Debugging and Profiling Tools
This document summarizes how ASan, TSan, Valgrind Memcheck, Valgrind Helgrind, Valgrind Massif, and Linux perf work, followed by a recommended order for using them to validate and optimize native applications.
These tools complement one another. None proves that a program has no memory errors, races, deadlocks, or performance problems: a dynamic tool can observe only behavior exercised by its workload.
- 1. AddressSanitizer (ASan)
- 2. ThreadSanitizer (TSan)
- 3. Valgrind Memcheck
- 4. Valgrind Helgrind
- 5. Valgrind Massif
- 6. Linux perf
- 7. Recommended Order
1. AddressSanitizer (ASan)
What it detects
- Heap, stack, and global buffer overflows
- Use-after-free
- Some use-after-return and use-after-scope errors
- Invalid, double, or mismatched deallocation
- Leaks when LeakSanitizer is supported and enabled
How it works
ASan combines compiler instrumentation with an ASan runtime. The compiler inserts checks into the generated program, while the runtime maintains metadata about which memory ranges may legally be accessed.

The program still runs as native machine code. ASan is not a virtual machine. The additional compiler-generated instructions consult the runtime’s shadow memory before relevant loads and stores.
Division of responsibility
The compiler and runtime have different roles:
- The compiler instruments relevant memory reads and writes, lays out stack red zones, emits global-object metadata, and adds lifetime operations where needed.
- The runtime intercepts common heap allocation functions such as
malloc,free,new, anddelete; creates heap red zones; maintains shadow memory; quarantines freed blocks; and produces error reports. - The operating system and CPU still manage virtual memory at page granularity. They usually do not know the boundaries of individual C or C++ objects.
ASan does not necessarily make a normal function call before every access. The compiler commonly emits a small inline shadow check and calls the reporting runtime only when that check fails.
Allocation, red zones, and poisoning
For a heap request, the ASan allocator obtains a larger region than the program requested and returns only the user portion:
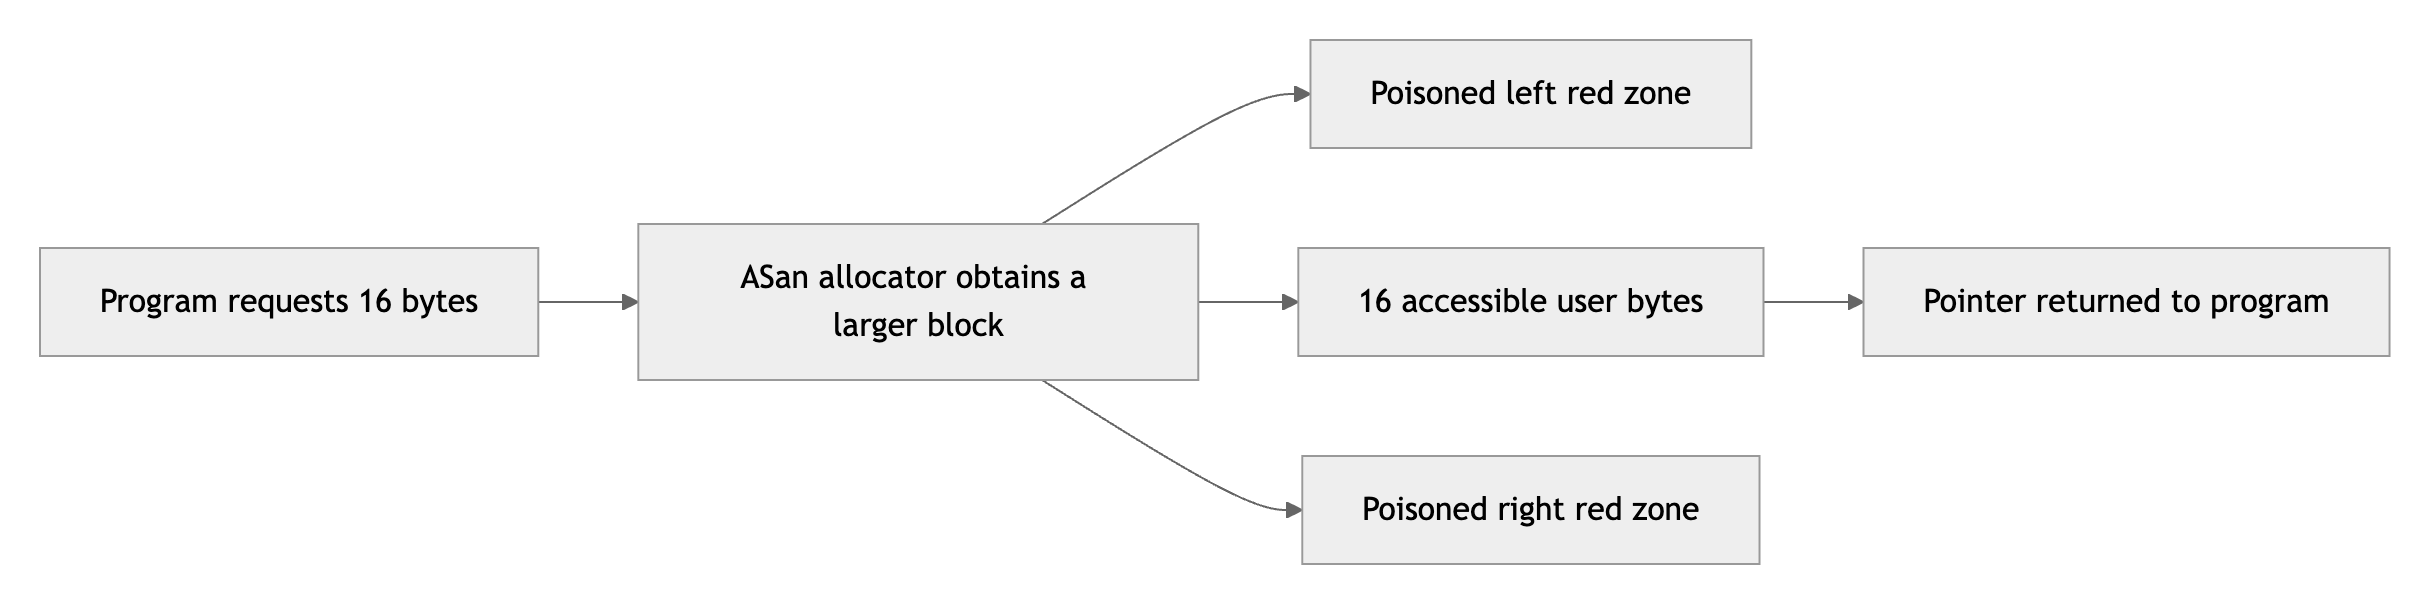
A red zone is padding placed before or after an object to expose an out-of-bounds access. A poisoned address is an application address whose corresponding shadow metadata says that instrumented code must not access it. Poisoning changes shadow metadata, not necessarily the bytes or operating-system page permissions of the application region.
ASan also creates red zones around stack and global objects. The exact mechanism differs by storage type: heap operations are tracked by the runtime allocator, while the compiler supplies stack layout and global-object information.
Shadow memory
ASan reserves part of the virtual address space as shadow memory. A fast arithmetic mapping converts an application address to its shadow address. A common mapping uses one shadow byte to describe eight application bytes:
shadow_address = (application_address >> 3) + shadow_offset
Conceptually:
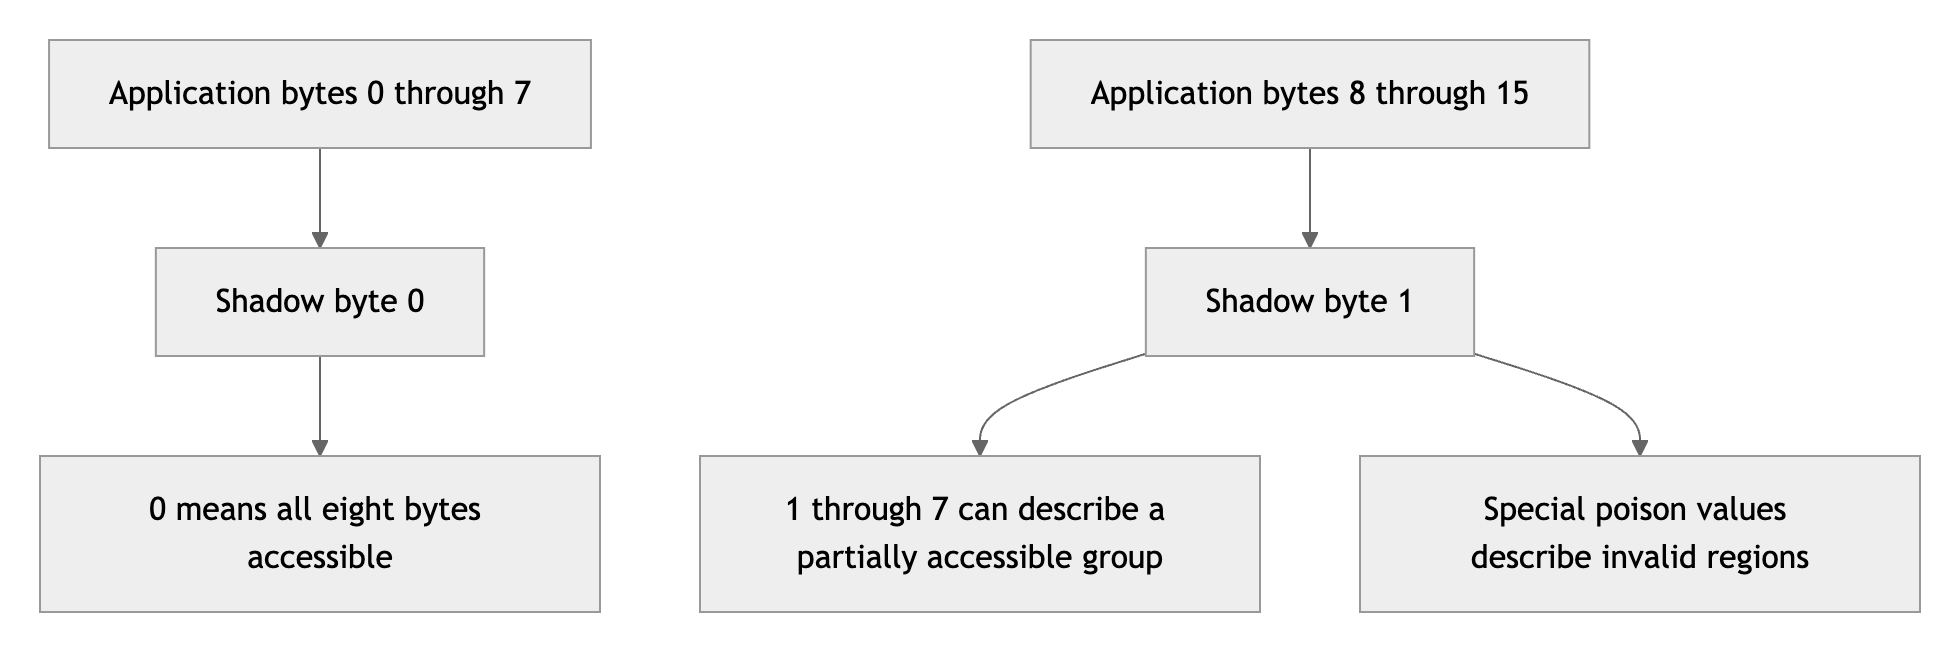
Shadow metadata can distinguish accessible bytes, partially accessible final groups, heap red zones, freed heap regions, stack red zones, and other poisoned states. This gives ASan object-level knowledge that ordinary page protection does not provide.
Checking a memory access
For a source operation such as value = buffer[index], the compiler
conceptually adds this decision before the actual load:
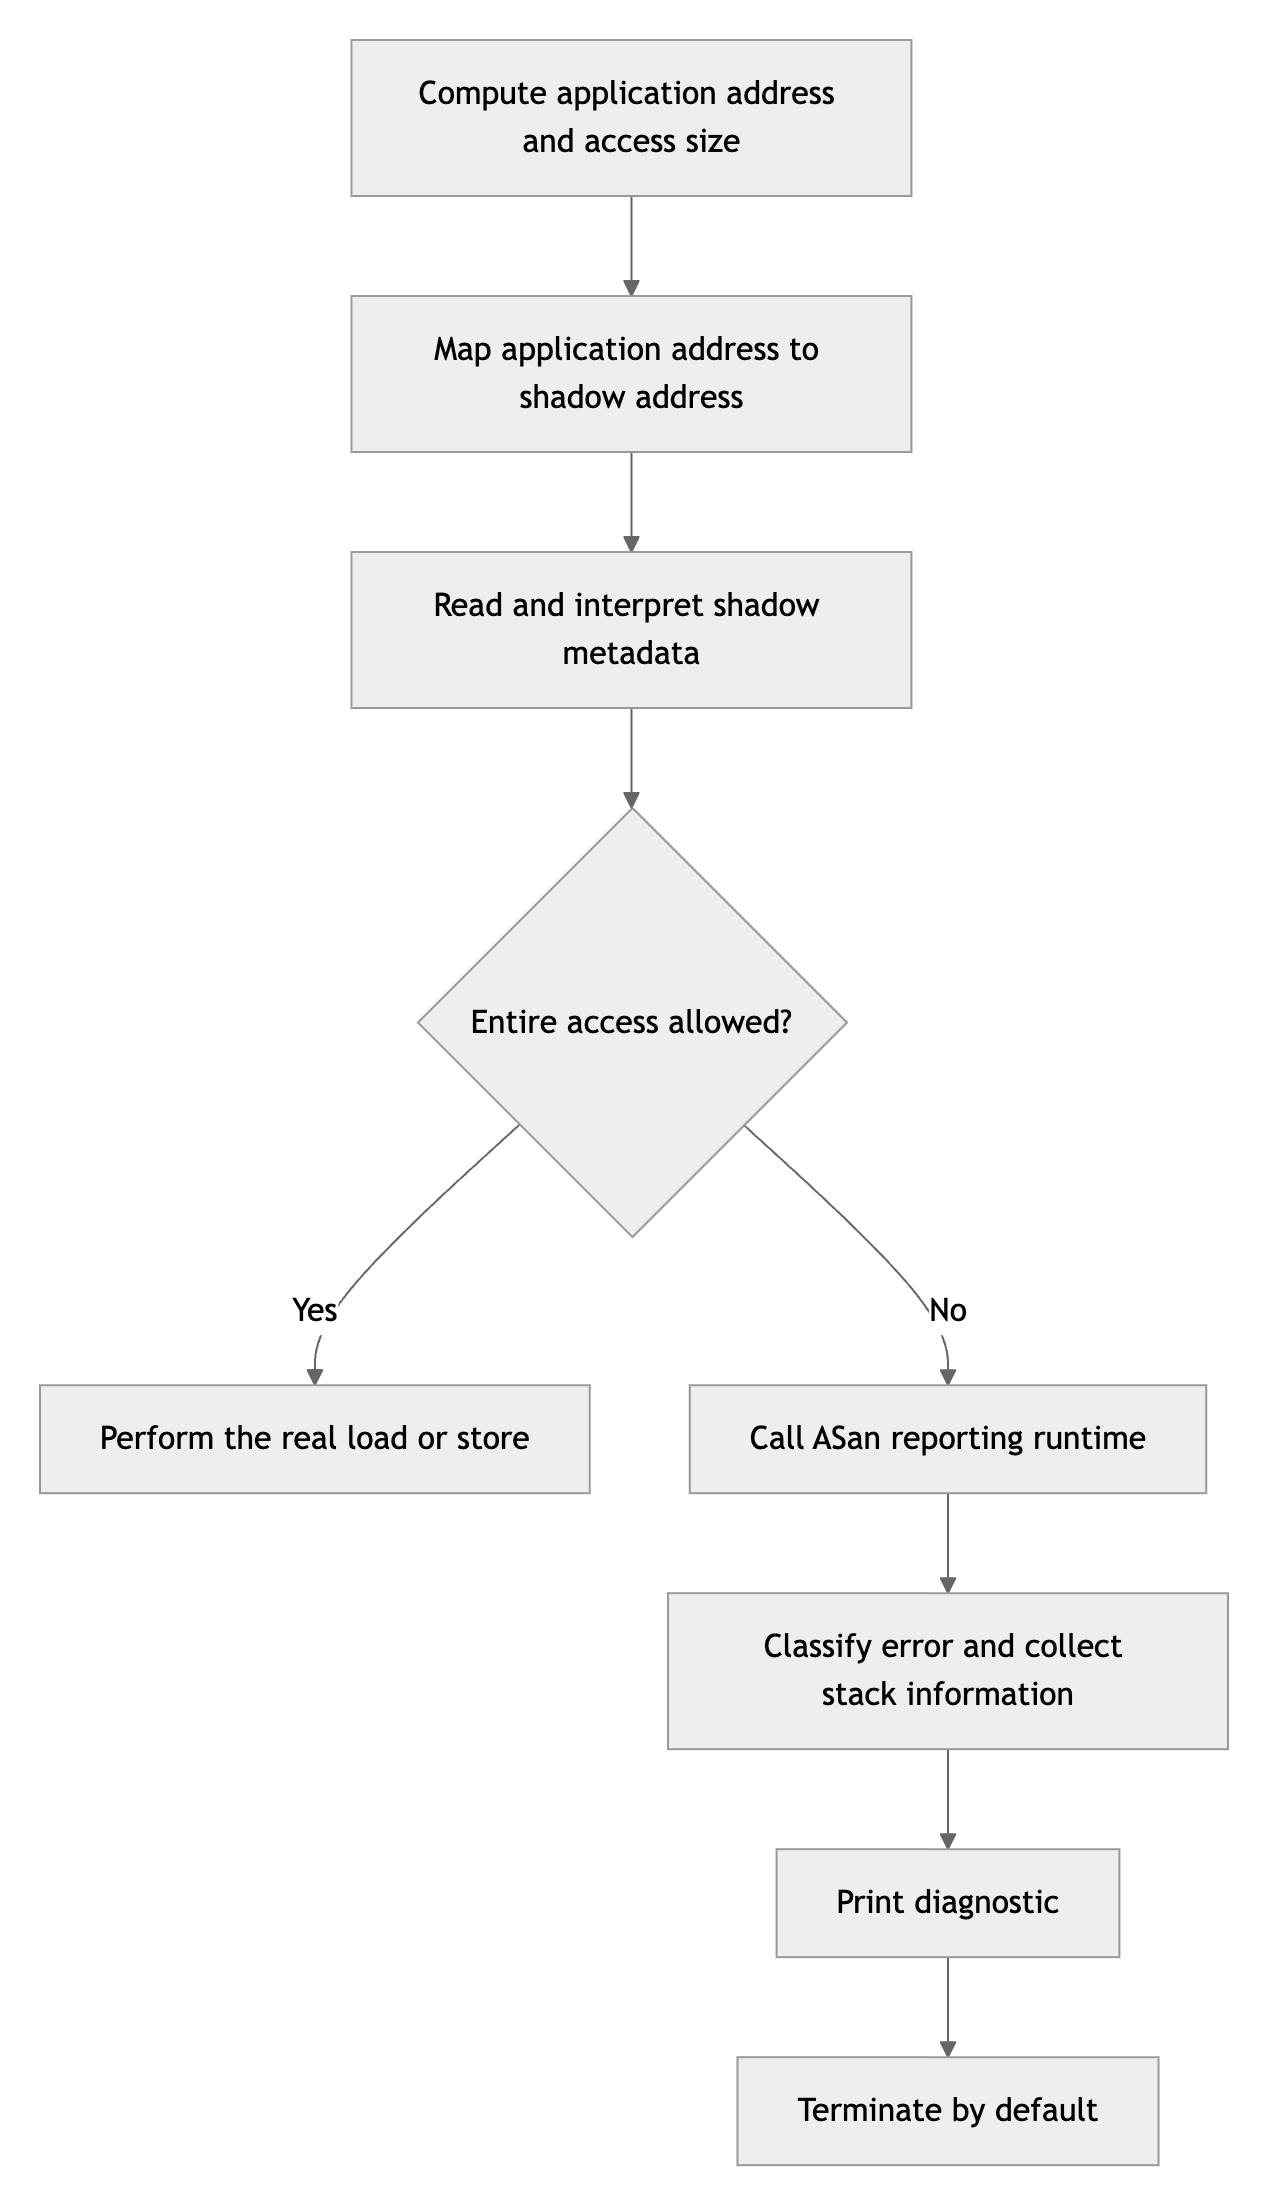
The real implementation is optimized and handles access size, alignment, and partially addressable shadow groups. The diagram describes the decision at a conceptual level.
An overflow may point into a memory page that is mapped and writable, so the CPU would normally allow it:
C++ object boundary:  [ valid object ][ out-of-bounds location ]
OS page boundary:     [          mapped writable page          ]
ASan shadow state:    [ accessible   ][ poisoned               ]
This explains why a program can appear to run normally without ASan while silently corrupting adjacent memory. ASan sees the finer object boundary and normally stops the program before the invalid instrumented access executes.
Free, quarantine, and use-after-free
When an allocation is freed, ASan validates the deallocation, poisons the user region, and usually retains it temporarily in a quarantine:
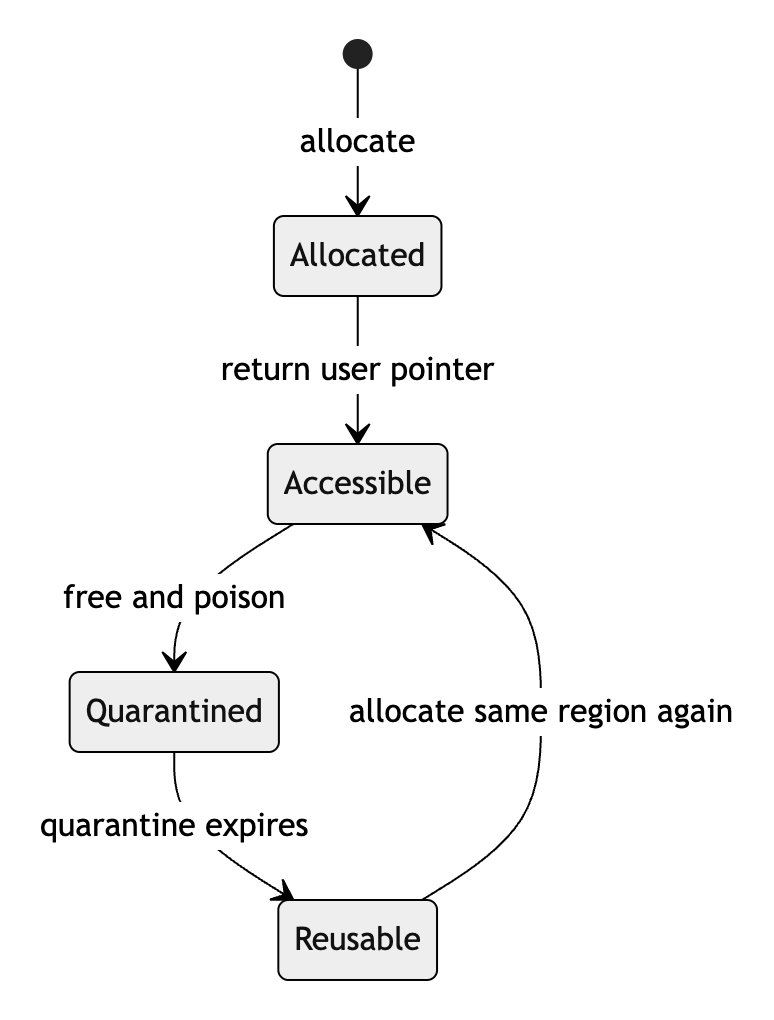
The quarantine delays immediate address reuse, increasing the chance that a dangling-pointer access reaches poisoned memory and is diagnosed as use-after-free. If the region is legitimately reused for a new allocation, ASan unpoisons the new user portion and establishes new red zones.
Reporting and termination
By default, a failed check invokes an ASan reporting function. The runtime classifies the problem, prints the access stack and available allocation or free stacks, and terminates the process. ASan is therefore normally a fail-fast detector rather than a passive observer.
Recovery mode can be enabled with compiler and runtime options, but execution after undefined behavior is not trustworthy. Continuing can perform the invalid write, corrupt state, and produce secondary reports.
What shadow memory can and cannot prove
ASan determines whether an address range is accessible according to allocation and compiler-provided object-lifetime metadata. It can detect an invalid access even when the operating system considers the containing page valid.
It does not understand every high-level program invariant. It may miss an incorrect access that remains within an accessible allocation, an access performed entirely by uninstrumented code, or use-after-free after the address has already been validly reused. It also does not replace a data-race detector or comprehensive uninitialized-value tracking.
Use the sanitizer flag when compiling and linking:
-fsanitize=address -fno-omit-frame-pointer
Debug symbols are not needed to detect an error, but they provide useful function names, files, and line numbers. Instrument all relevant libraries when possible; code executed entirely in an uninstrumented library creates blind spots.
ASan is commonly around twice as slow as a normal build, although the real cost varies. It is not a data-race or deadlock detector and is less comprehensive than Memcheck for tracking uninitialized values.
2. ThreadSanitizer (TSan)
What it detects
TSan primarily detects data races: conflicting accesses to the same memory from different threads, with at least one write, when no recognized synchronization orders them.
How it works
TSan combines compiler instrumentation with a thread-analysis runtime. The compiler inserts calls or inline checks around relevant memory operations. The runtime tracks threads, observed memory accesses, and synchronization to determine whether conflicting accesses have a valid ordering.
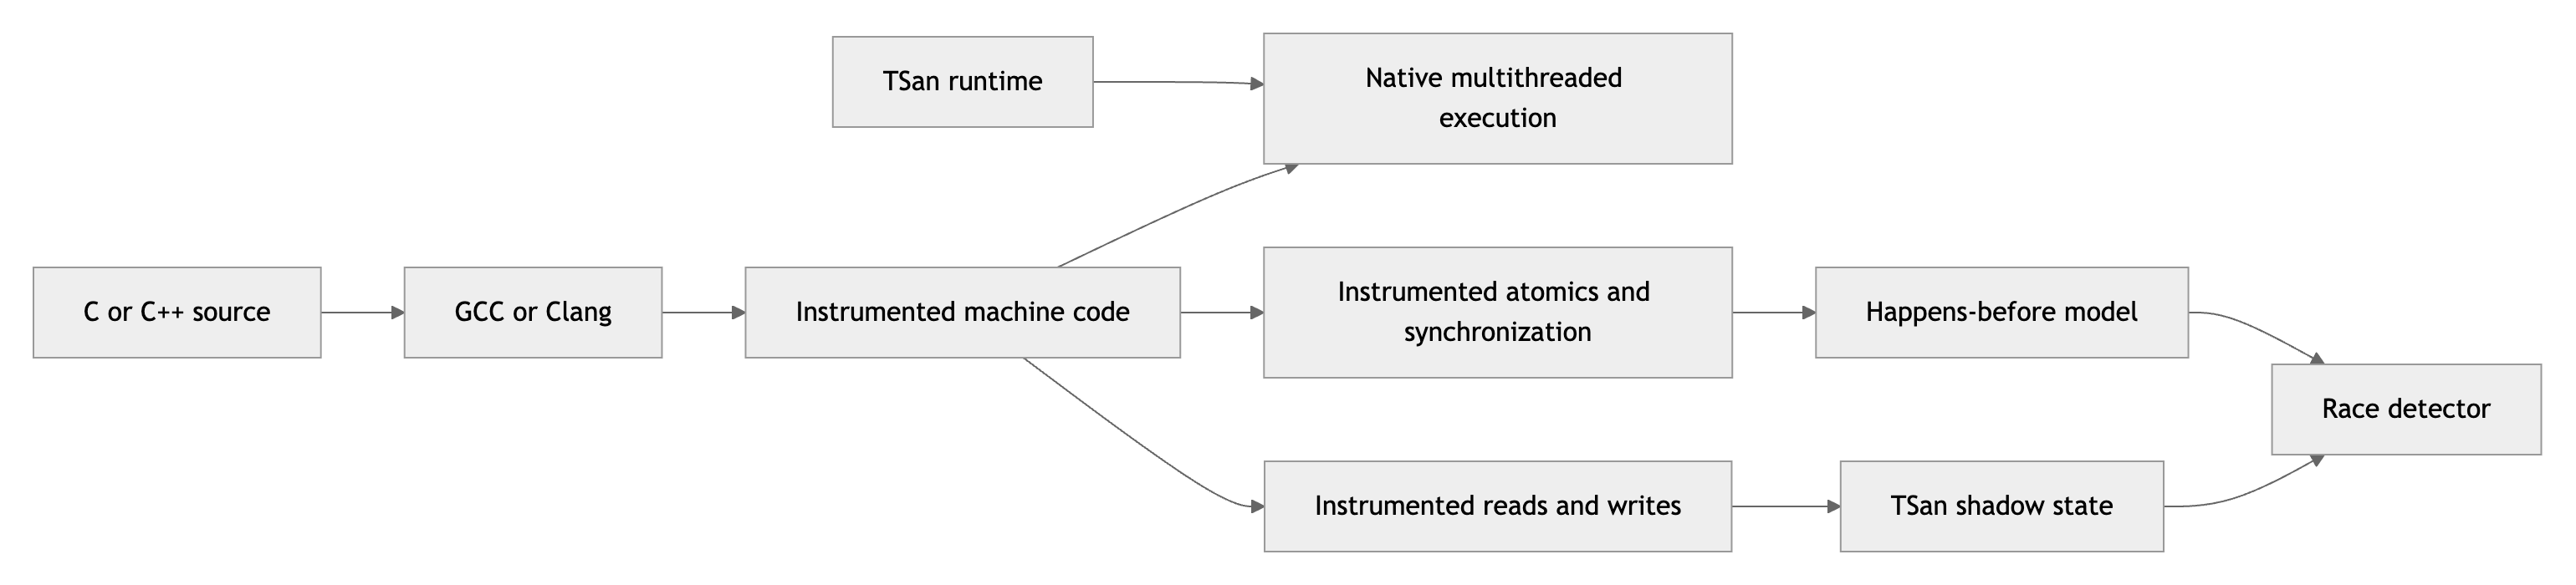
The application still executes native instructions. TSan is not a virtual machine and it does not rely on periodic sampling. Its instrumentation observes the relevant operations as they execute.
What the compiler and runtime observe
The compiler instruments ordinary loads and stores that may participate in shared-memory communication. The runtime also observes or intercepts supported threading operations, including:
- thread creation and completion;
- mutex locking and unlocking;
- condition-variable waits and notifications;
- atomic operations;
- supported semaphores and other synchronization primitives;
- memory allocation and deallocation where needed for tracking.
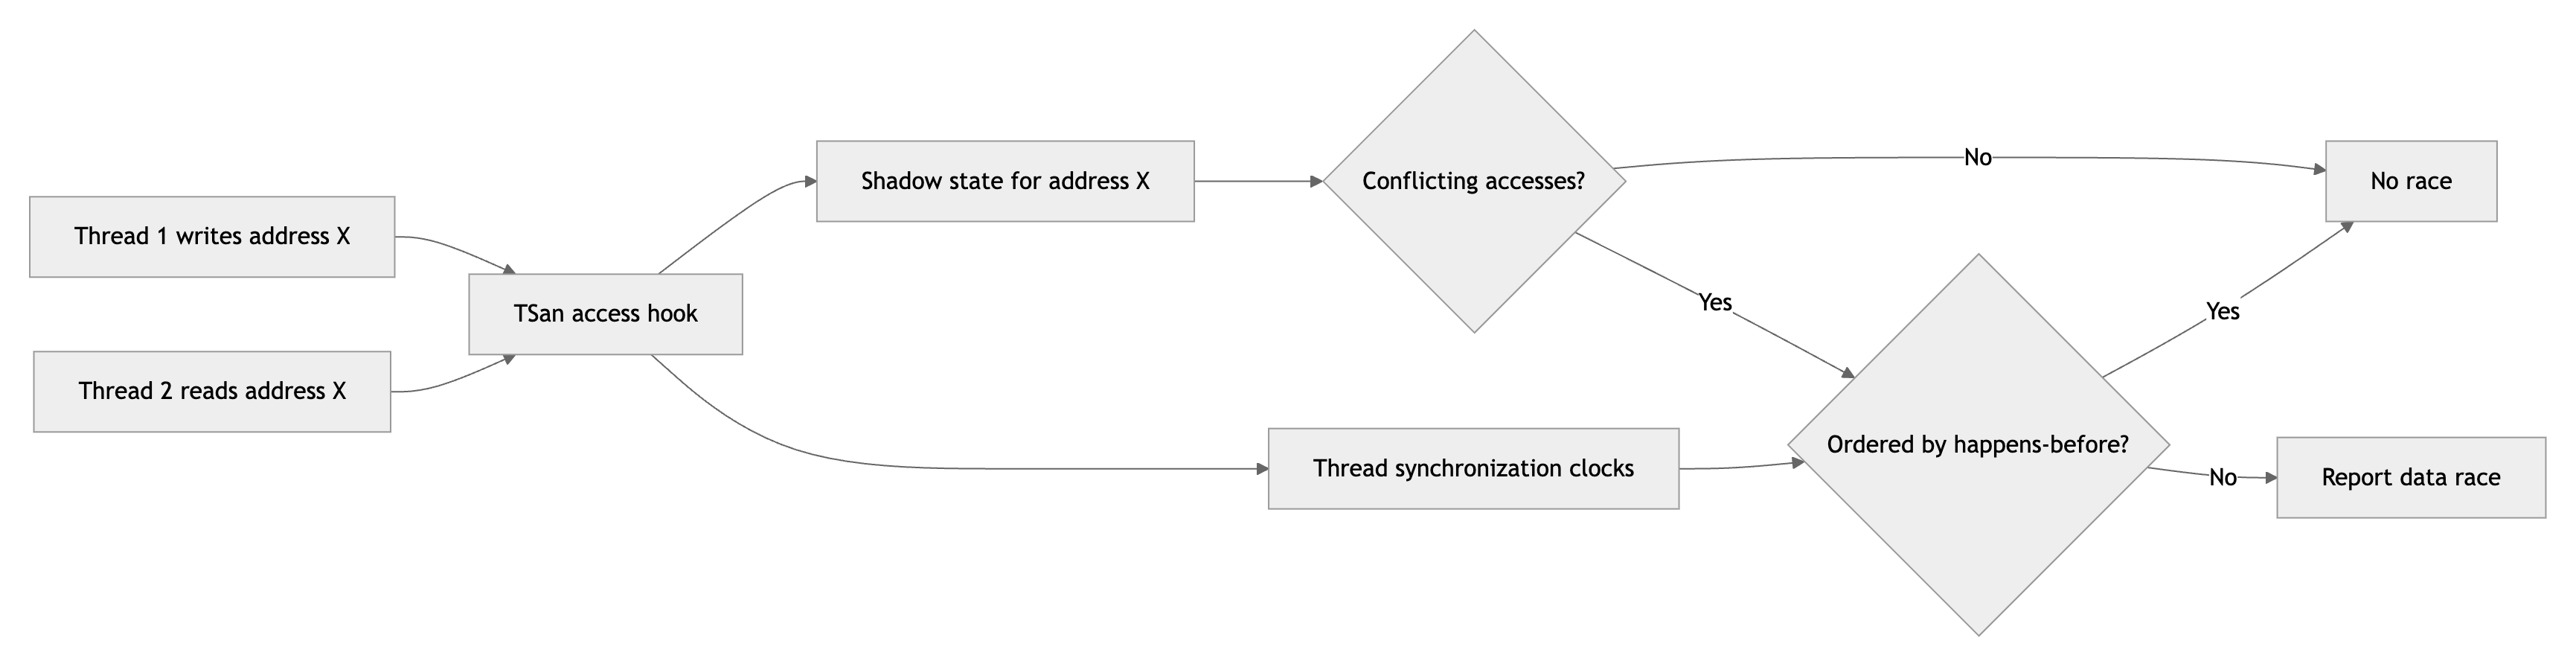
Conceptually, an instrumented memory access tells the runtime:
thread identity + memory address + access size + read/write kind + logical time
TSan stores compact shadow state associated with application memory. This state summarizes relevant earlier accesses, such as the accessing thread, access type, size, and logical epoch. The real representation is heavily optimized and does not simply keep an unlimited log of every access.
Conflicting accesses
Two observed accesses conflict when:
- they involve overlapping memory locations;
- they come from different threads;
- at least one access is a write.
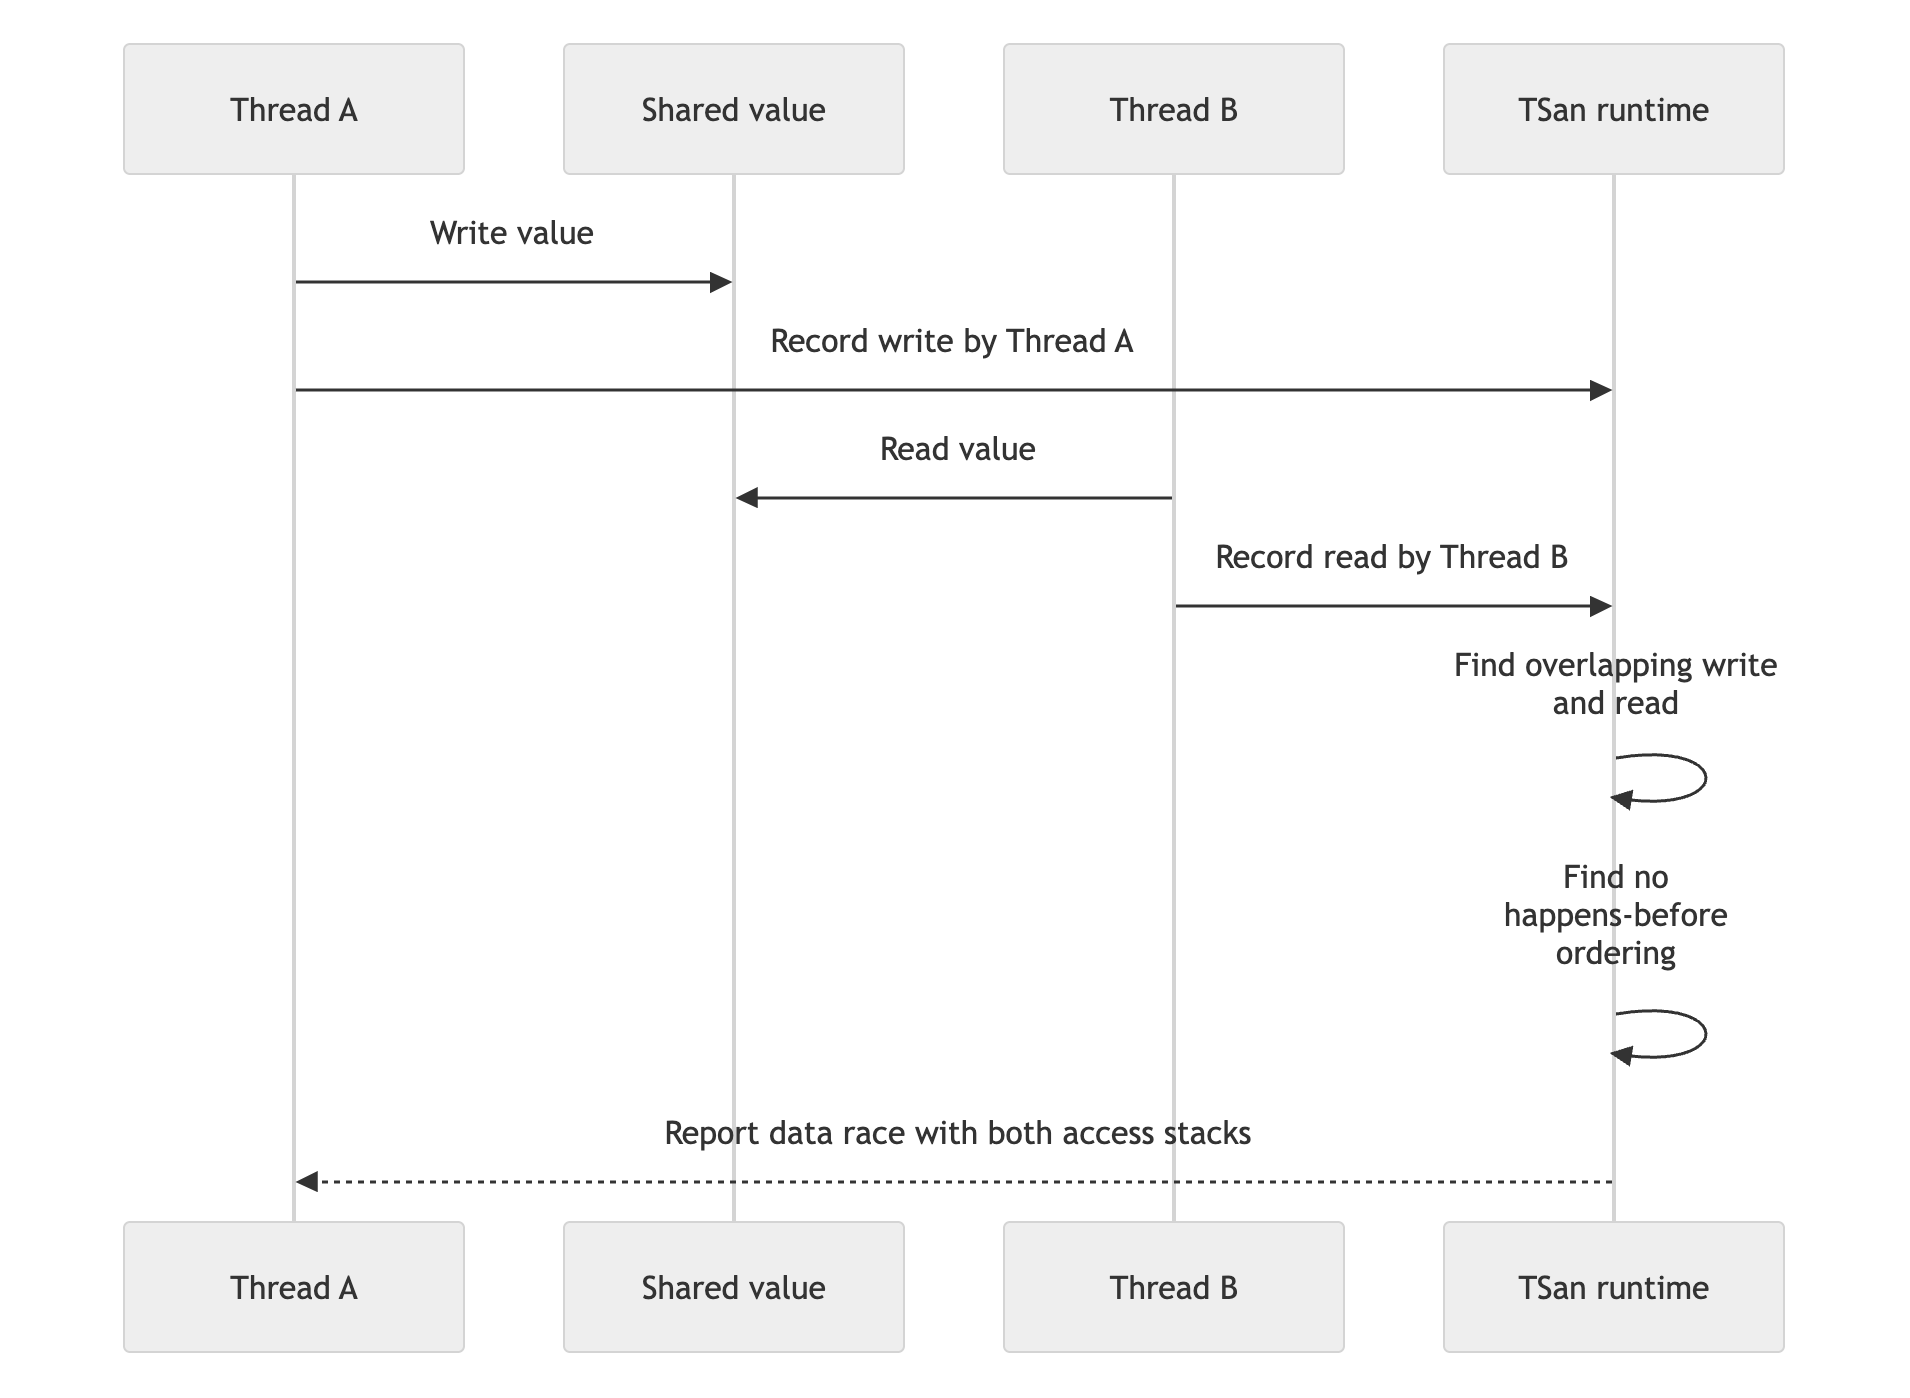
A conflict becomes a data-race report when the accesses are not ordered by a recognized happens-before relationship. They do not need to occur at the exact same physical instant. If either execution order is possible without synchronization, they are logically concurrent for race detection.
For example:
int value = 0;

void first()
{
    value = 1;
}

void second()
{
    int copy = value;
}
If the functions execute in different threads with no synchronization, TSan can
observe a write and read of value that have no happens-before ordering.
Happens-before ordering
Happens-before is a logical ordering relation built from program order and recognized synchronization. TSan commonly represents this ordering using vector-clock-like metadata or optimized epochs.
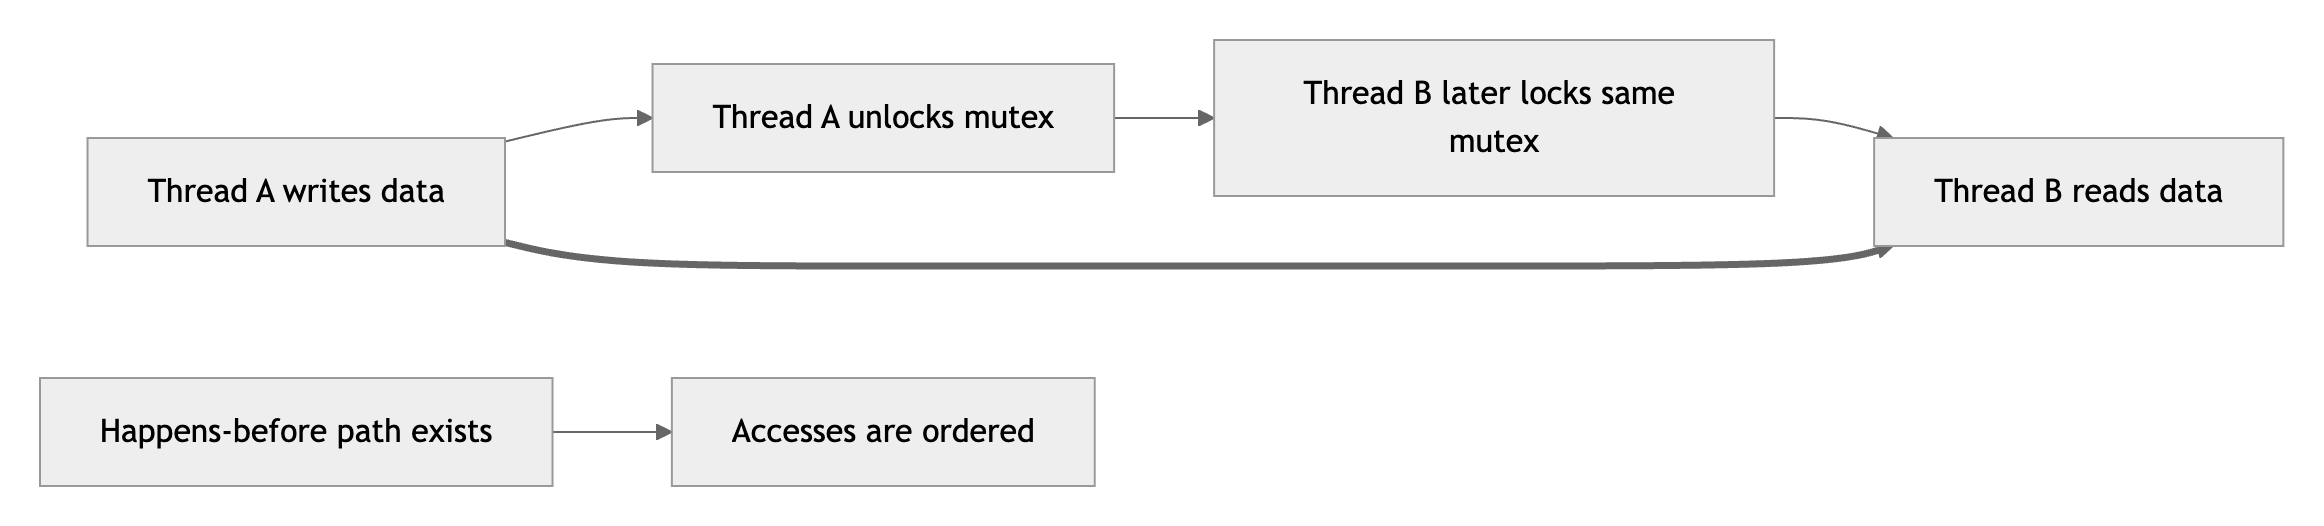
A mutex creates an ordering edge. Operations before an unlock happen before operations after a later successful lock of the same mutex:
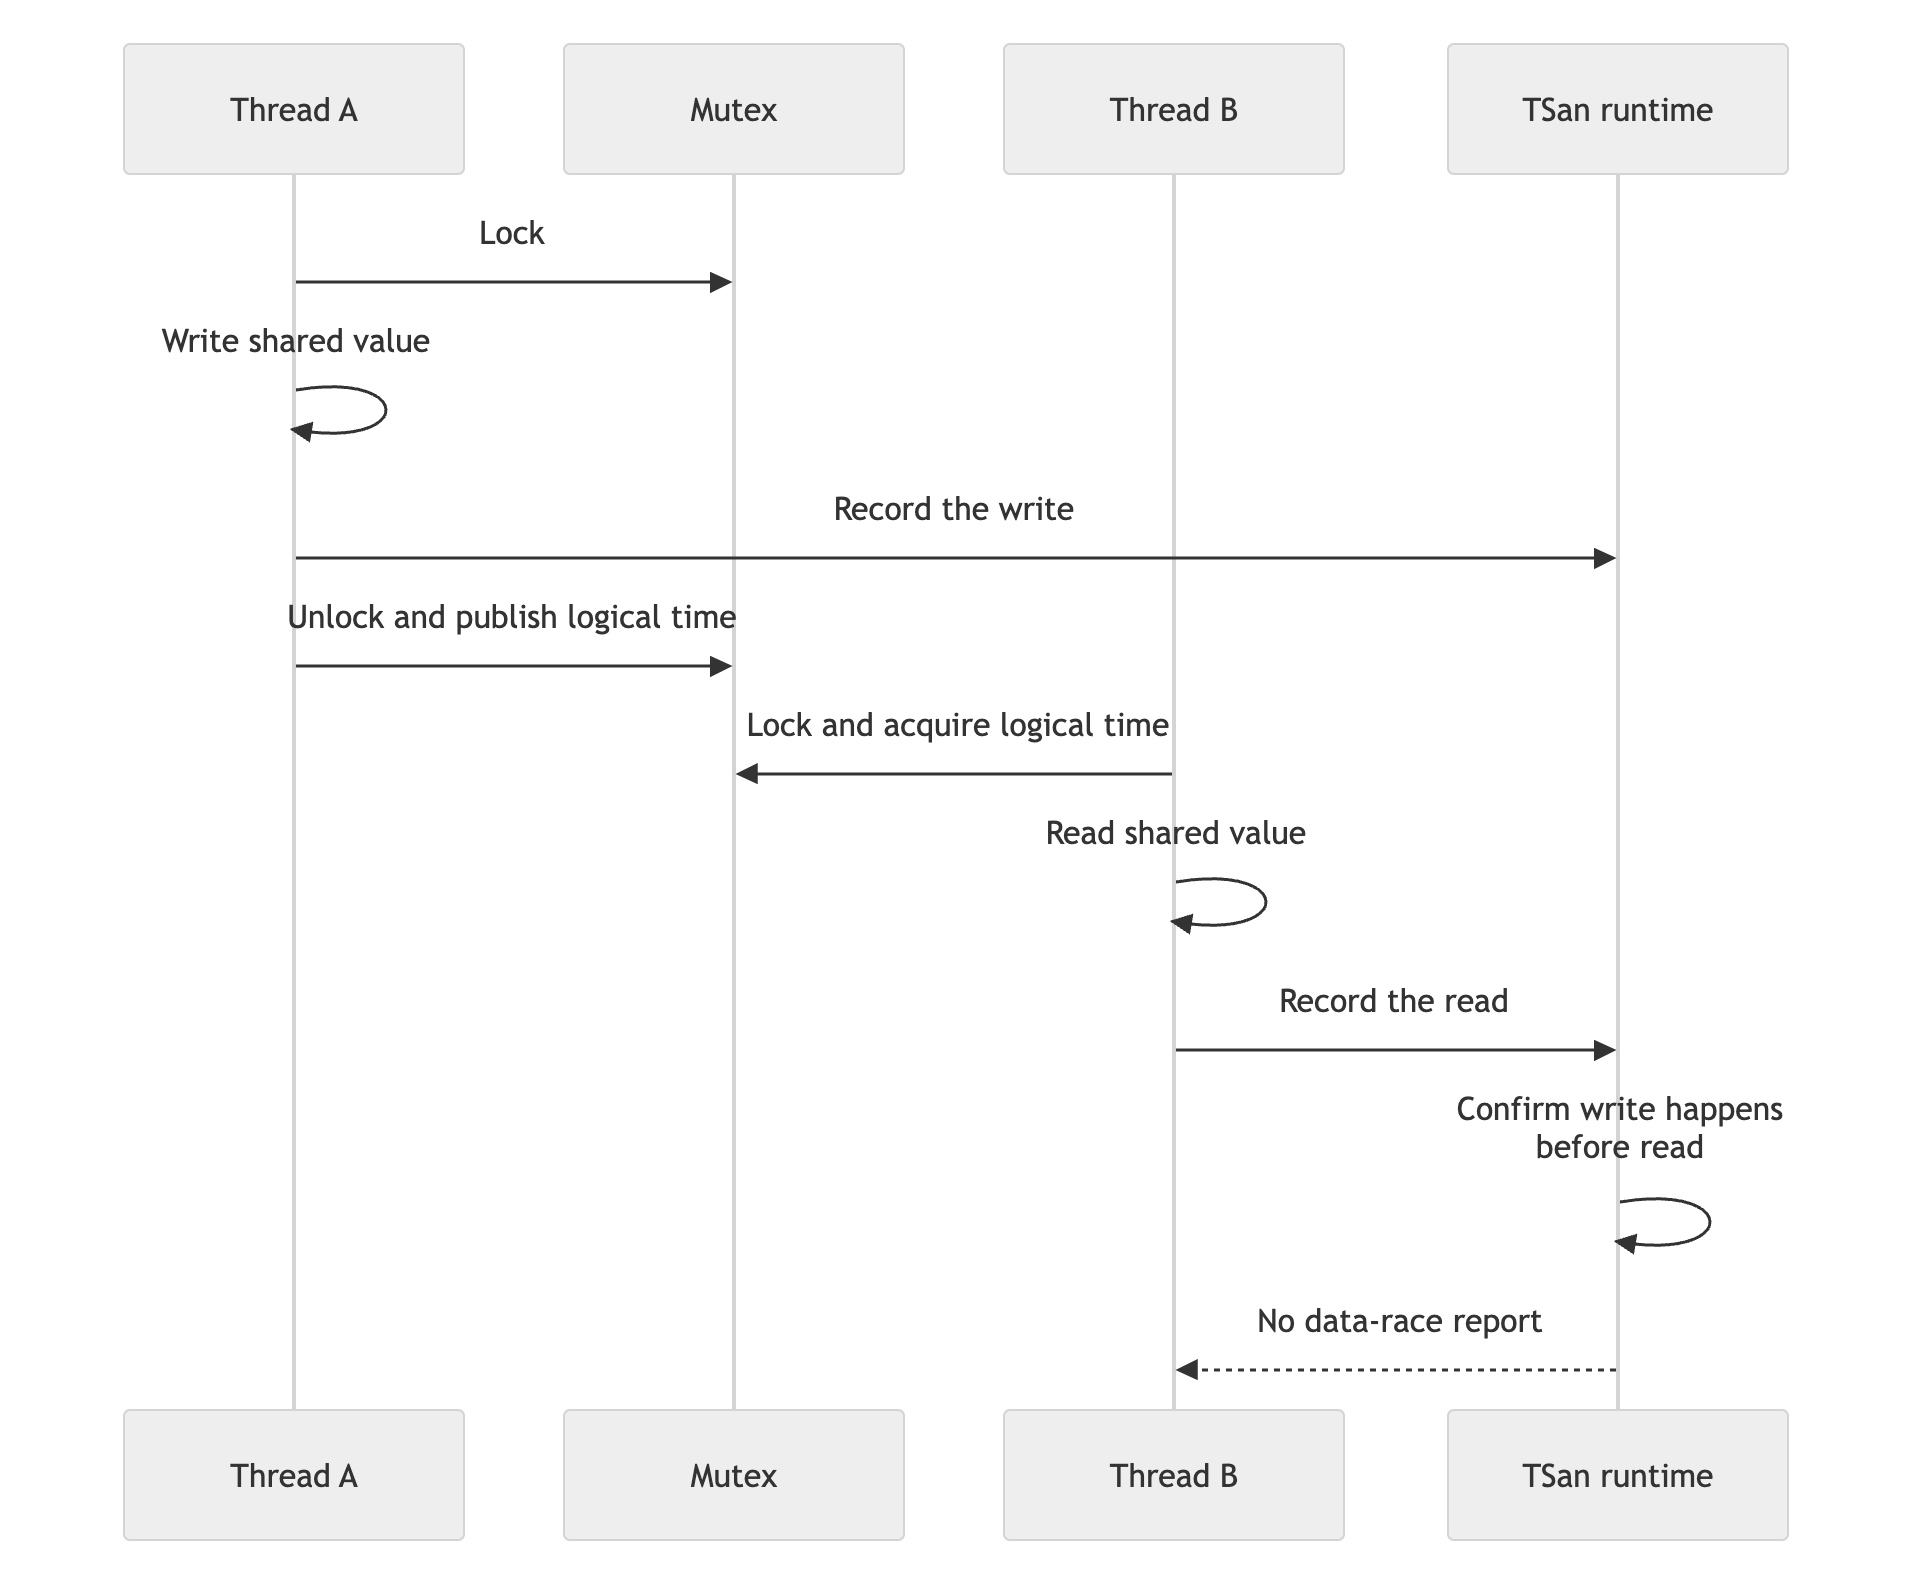
Thread creation and joining also establish ordering. A child observes actions sequenced before its creation, and a successful join orders the child’s prior actions before the joining thread continues. Atomics provide ordering according to their supported memory-order semantics.
TSan reasons about synchronization semantics, not merely elapsed wall-clock time:
Race reporting
When TSan finds an unordered conflict, it normally reports:
- the memory address and access size;
- whether each access was a read or write;
- the current and previous access stacks;
- the involved thread IDs;
- thread-creation stacks when available;
- related mutex information when relevant.
Unlike ASan’s usual fail-fast behavior, TSan commonly reports a race and allows execution to continue so that it can find more races. Runtime options can make it halt after the first report. A reported execution is not trustworthy merely because the process continued.
Build requirements
Use the sanitizer flag when compiling and linking:
-fsanitize=thread -fno-omit-frame-pointer
Debug symbols are not required for detection, but they make reports much easier to interpret. Ideally, the application and all relevant libraries are instrumented. Memory operations performed entirely inside uninstrumented code may be invisible, although intercepted synchronization or runtime calls may still be observed.
ASan and TSan normally cannot be enabled in the same process because their runtime and shadow-memory requirements conflict, so use separate builds.
What TSan can and cannot prove
TSan finds only races reached by the executed workload and thread schedules. A clean run means that no race was observed in that run, not that the program is race-free.
TSan may have incomplete understanding of custom synchronization, inline assembly, unsupported runtimes, or uninstrumented libraries. Such gaps can produce missed races or misleading reports. Custom synchronization sometimes requires sanitizer annotations or a supported primitive.
TSan detects data races, which are unsynchronized conflicting memory accesses. It does not determine whether every synchronized algorithm is logically correct, and it is not a general proof of deadlock freedom. Deadlock analysis still requires lock-order review, targeted tests, stress execution, timeouts, and possibly a complementary tool such as Helgrind.
TSan commonly imposes substantial CPU and memory overhead because every relevant access updates analysis metadata. Exact overhead depends strongly on the workload.
3. Valgrind Memcheck
What it detects
- Invalid reads and writes
- Use-after-free
- Invalid or mismatched deallocation
- Use of uninitialized values
- Unsafe overlapping memory operations
- Memory leaks
The Valgrind execution model
Memcheck, Helgrind, and Massif are tools built on the Valgrind core. Their most important difference from ASan and TSan is where instrumentation is introduced:
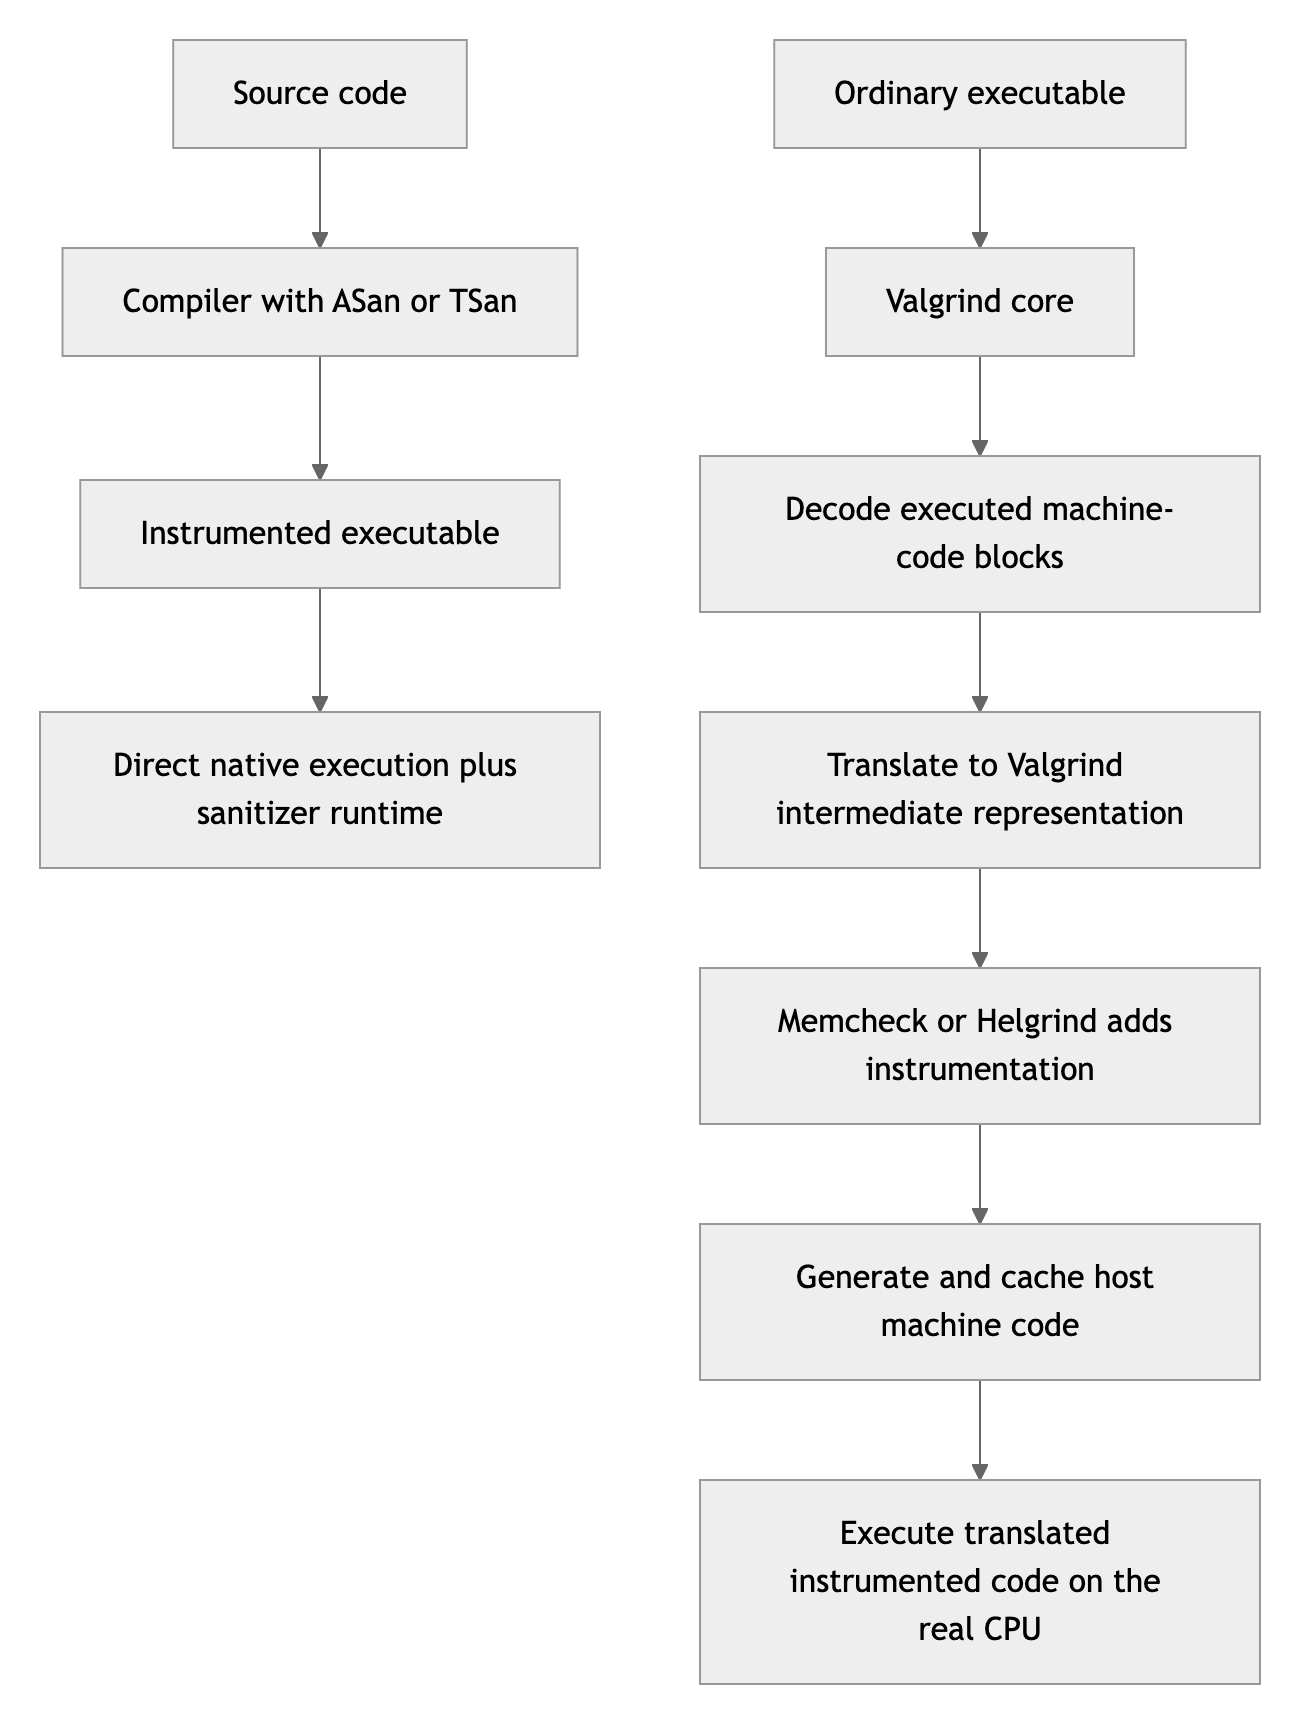
ASan and TSan checks are selected and inserted by the compiler before the program starts. Valgrind instead gains control at process startup and dynamically translates the executable’s machine instructions before allowing their translated forms to run.
Valgrind is similar to a user-space virtual execution environment, but it is not a complete virtual machine. It does not boot a guest operating system or emulate a separate computer. The application still uses the host kernel, filesystem, devices, virtual memory, and system calls.
What the kernel sees
For a normal invocation such as valgrind ./program, Valgrind and the
application are not two independent processes like GDB and its debuggee. The
kernel sees one Valgrind-managed process and address space containing the
Valgrind core, application state, translated-code cache, and analysis metadata.
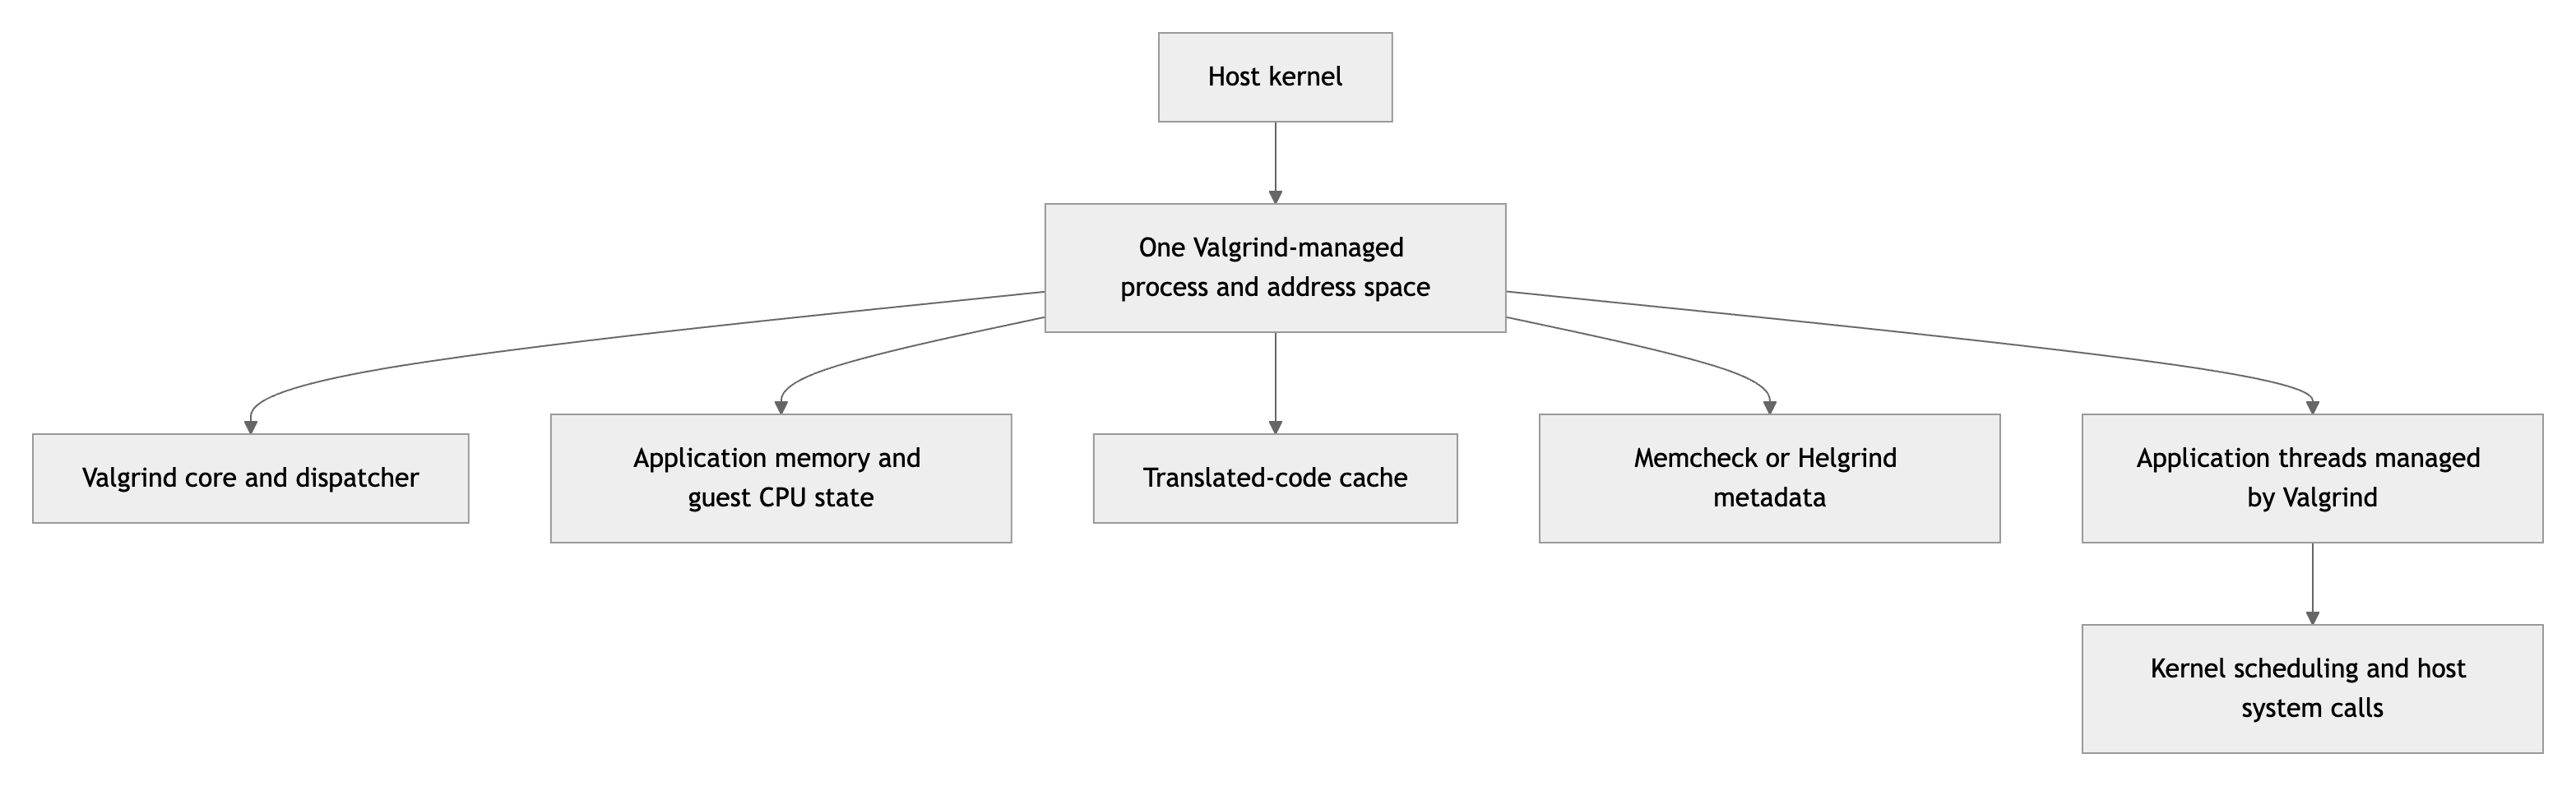
The application uses the native threading library, so its threads remain kernel-visible and the operating-system scheduler still decides which ready thread runs. However, Valgrind uses an internal lock to serialize guest execution: only one kernel thread executes translated application code at a time. A thread periodically releases that lock so another ready thread can run.
The essential distinction is that there is no separate native target process whose original instructions run independently of Valgrind.
CPU time and memory reported by the operating system include both application work and Valgrind’s translation and analysis overhead.
How Valgrind controls instructions
Valgrind starts before the target entry point and maintains a virtualized guest CPU state, including the target program counter, registers, flags, and stack state. A dispatcher repeatedly finds or creates a translation for the next executable block:

Branches and calls are redirected to translated blocks or back to the dispatcher. The original application instructions therefore do not normally execute directly. The real CPU executes the host code generated by Valgrind, which reproduces the application operation while adding the selected checks.
Valgrind does not need PMU counters, CPU virtualization extensions, hardware breakpoints, or a Valgrind-specific kernel mode. It uses ordinary process, memory-mapping, signal, thread, and system-call facilities. It must explicitly support the host and target instruction set.
Because Valgrind needs to establish translated execution and analysis state from startup, it generally cannot attach to an already-running native process.
System calls and signals
A translated system-call instruction returns control to Valgrind. Valgrind can validate arguments, issue the real host system call, and update tool metadata before resuming translated application execution:
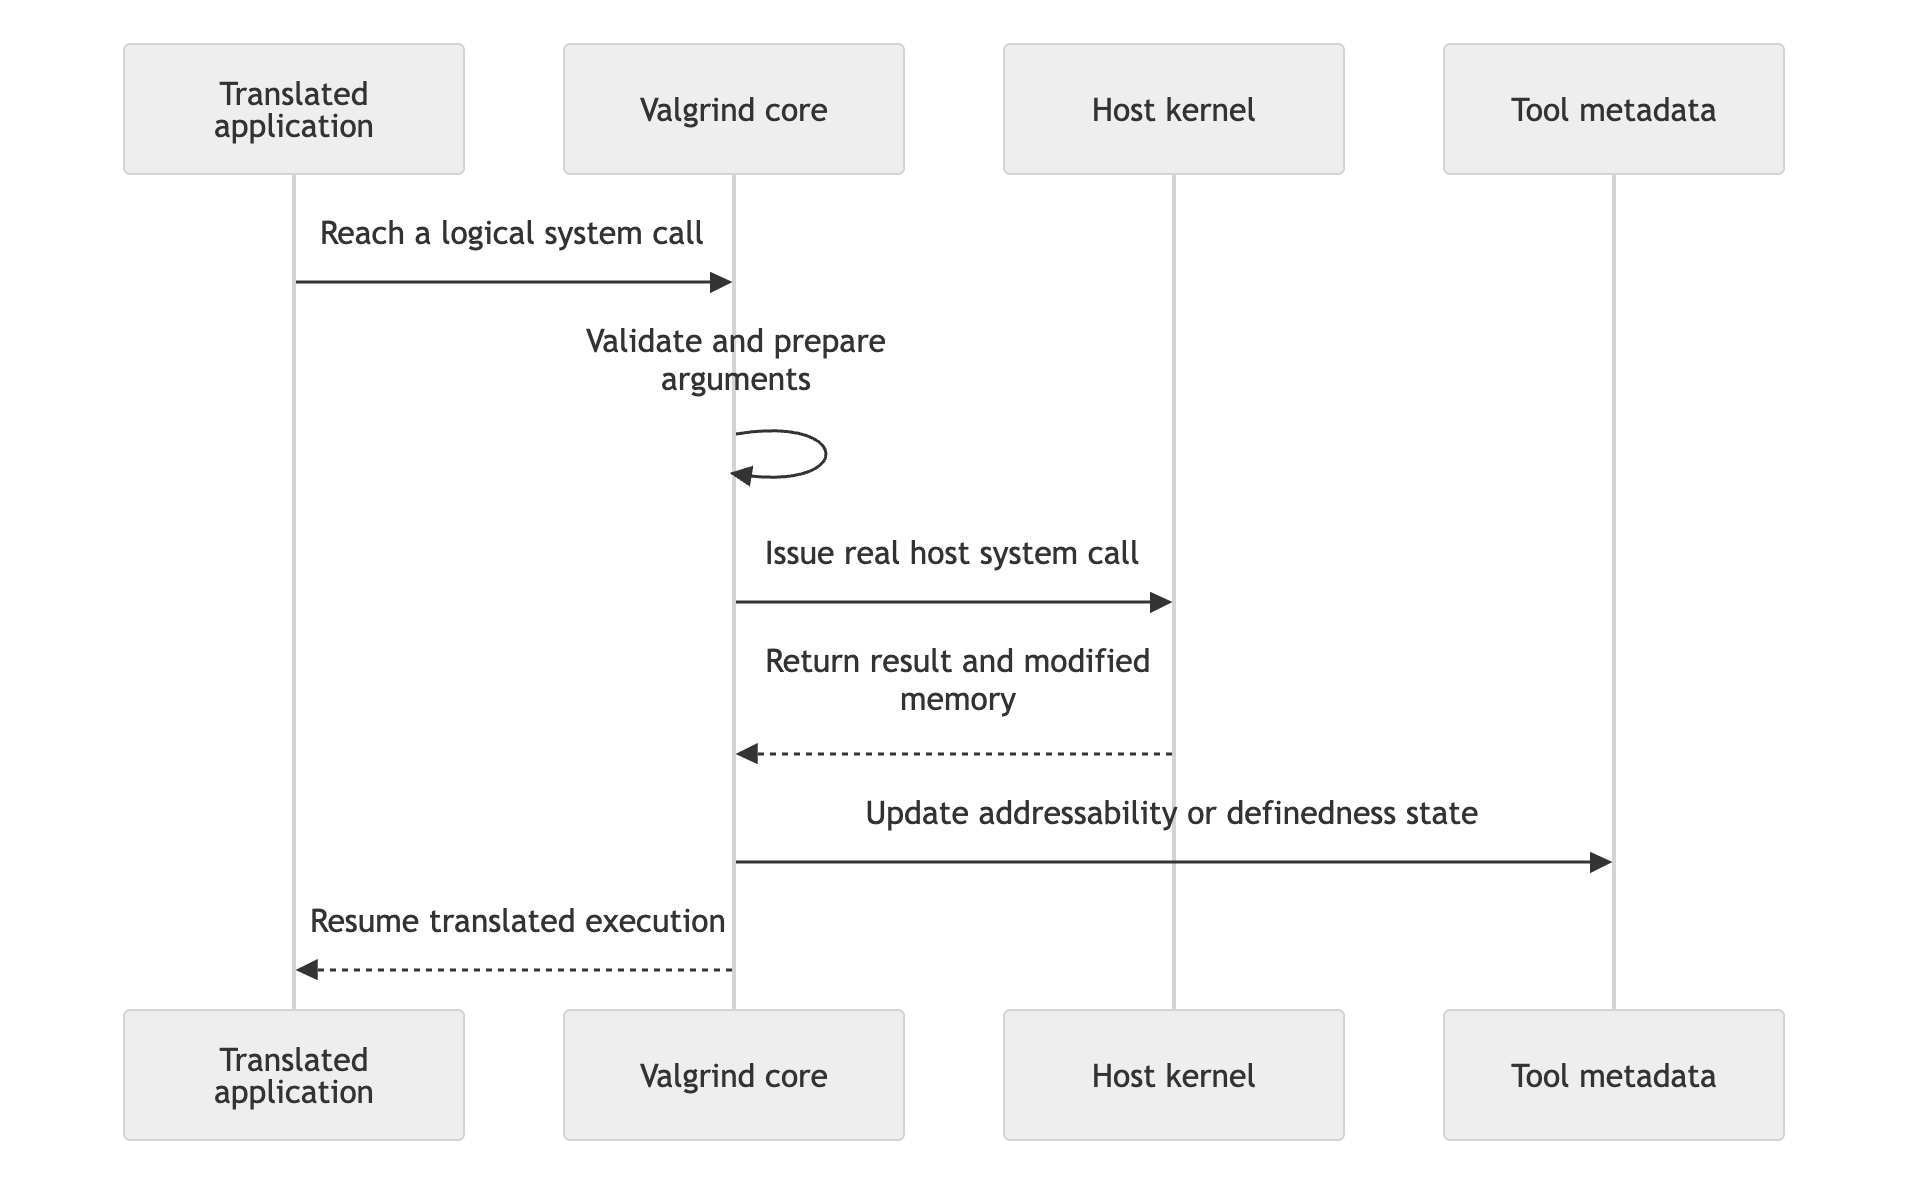
For example, after read(fd, buffer, size), Memcheck must mark the bytes
actually written by the kernel as defined. Valgrind similarly mediates signals
so guest-visible register, stack, and tool state remain consistent.
How Memcheck adds memory analysis
After Valgrind converts a machine-code block to its intermediate representation, Memcheck inserts checks and metadata operations around loads, stores, arithmetic, allocations, deallocations, and relevant system-call effects.

Memcheck maintains two conceptual kinds of shadow metadata:
- A-bits, or addressability: whether each application byte may legally be accessed.
- V-bits, or definedness: whether the individual bits of a value have a defined origin.
For each translated memory access, Memcheck first checks addressability. For valid reads, it propagates definedness from memory into the virtual register state. Arithmetic and copies propagate undefined bits until they reach a use that affects observable behavior, such as a conditional branch, system-call argument, address calculation, or output operation.
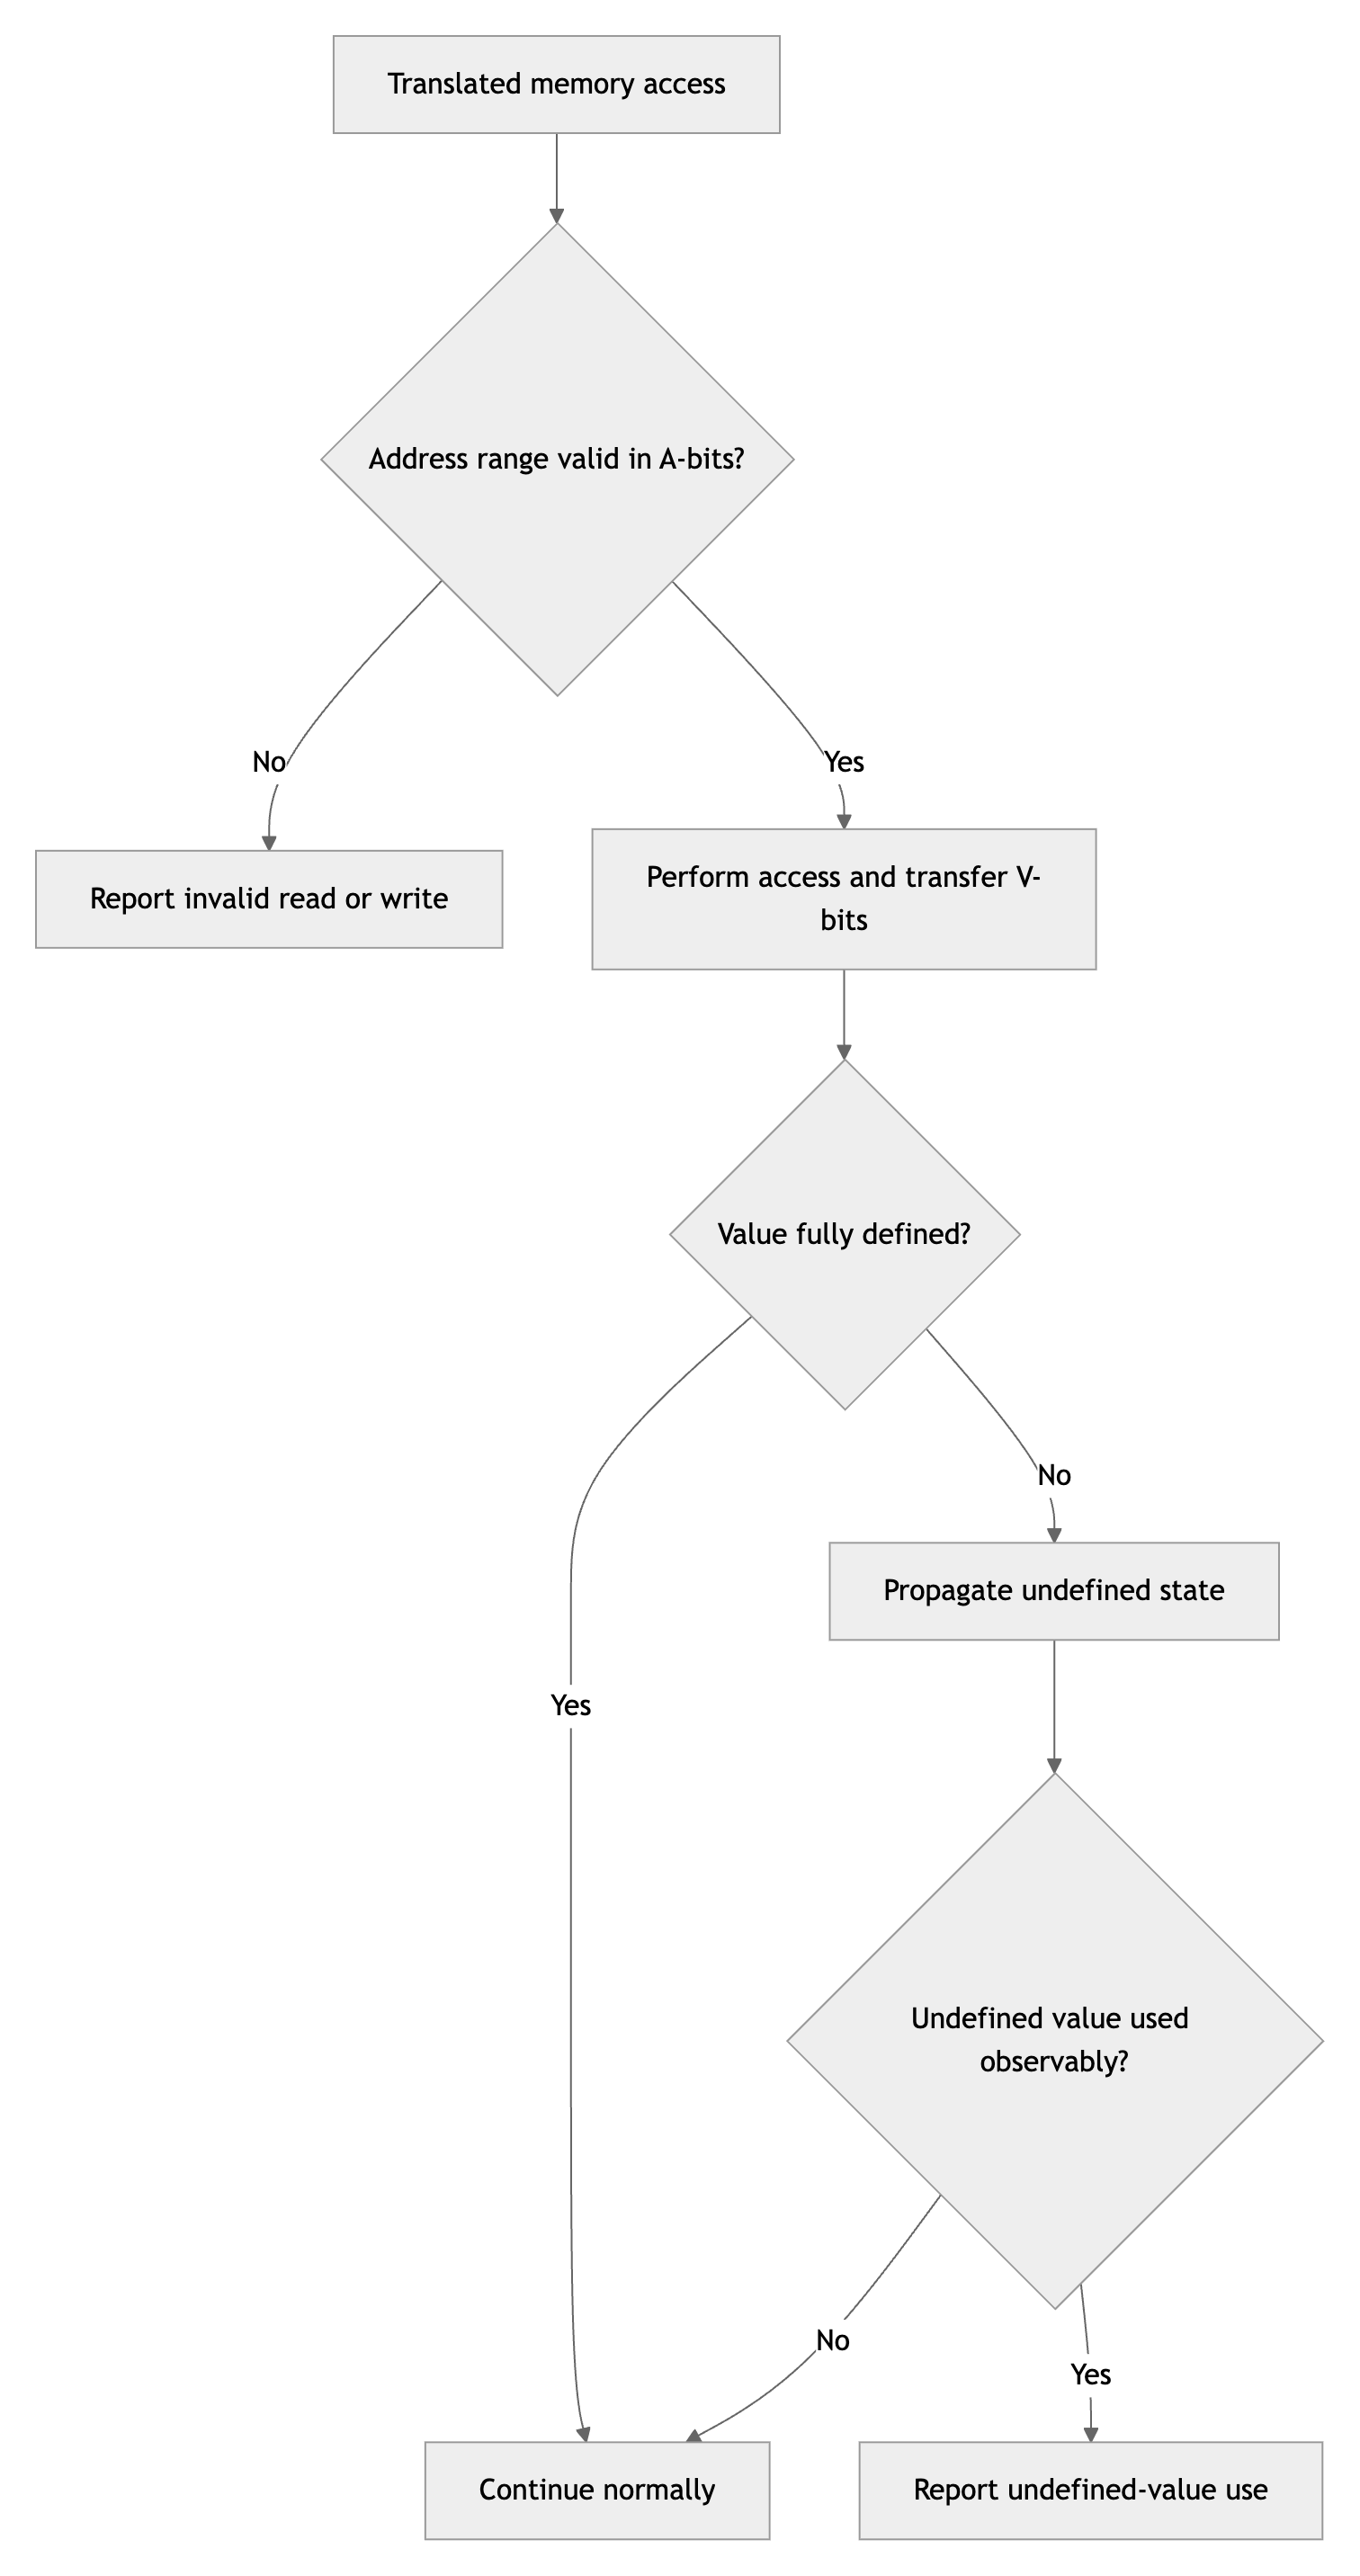
This extensive definedness propagation is a major difference from ASan. ASan primarily checks whether an address range is poisoned, while Memcheck tracks both whether the address is legal and whether the value is initialized.
Memcheck also observes allocation and deallocation. At exit, remaining memory is classified:
- Definitely lost: no pointer to it remains and it is normally a real leak.
- Indirectly lost: it is reachable only through another lost allocation.
- Possibly lost: only an ambiguous or interior pointer remains.
- Still reachable: a valid pointer remains, often retained global or library state rather than a true leak.
Memcheck compared with ASan
| Property | ASan | Valgrind Memcheck |
|---|---|---|
| Instrumentation time | Compilation | Runtime translation |
| Required executable | Sanitizer build | Usually an ordinary binary |
| Execution | Native with inserted checks | Translated instrumented blocks |
| Main metadata | Addressability/poisoning | Addressability and definedness |
| Uninitialized values | Limited | Detailed propagation |
| Stack/global bounds | Strong compiler knowledge | Less source-level knowledge |
| Uninstrumented libraries | Potential blind spots | Executed user code translated |
| Typical overhead | Lower | Much higher |
| Attach to running process | No | Generally no |
Memcheck needs no compiler instrumentation, although debug symbols remain strongly recommended for readable stacks and source lines:
valgrind --tool=memcheck \
  --leak-check=full \
  --show-leak-kinds=all \
  --track-origins=yes \
  ./test_program
Its detailed translation and metadata propagation often slow execution by an order of magnitude or more, so it is most practical for focused tests. Memcheck does not analyze data races or deadlocks.
4. Valgrind Helgrind
What it detects
- Data races
- Inconsistent lock ordering
- Some mutex and condition-variable misuse
How Helgrind uses Valgrind
Helgrind uses the same Valgrind-managed process and dynamic binary translation described above. Instead of adding A-bit and V-bit operations, it instruments machine-level memory accesses and observes supported synchronization operations.

Valgrind wrappers and interceptors expose supported thread creation, mutex, condition-variable, semaphore, and related operations to Helgrind. Helgrind combines the observed memory-access history with happens-before ordering and lockset information.
For a memory access, it conceptually asks:
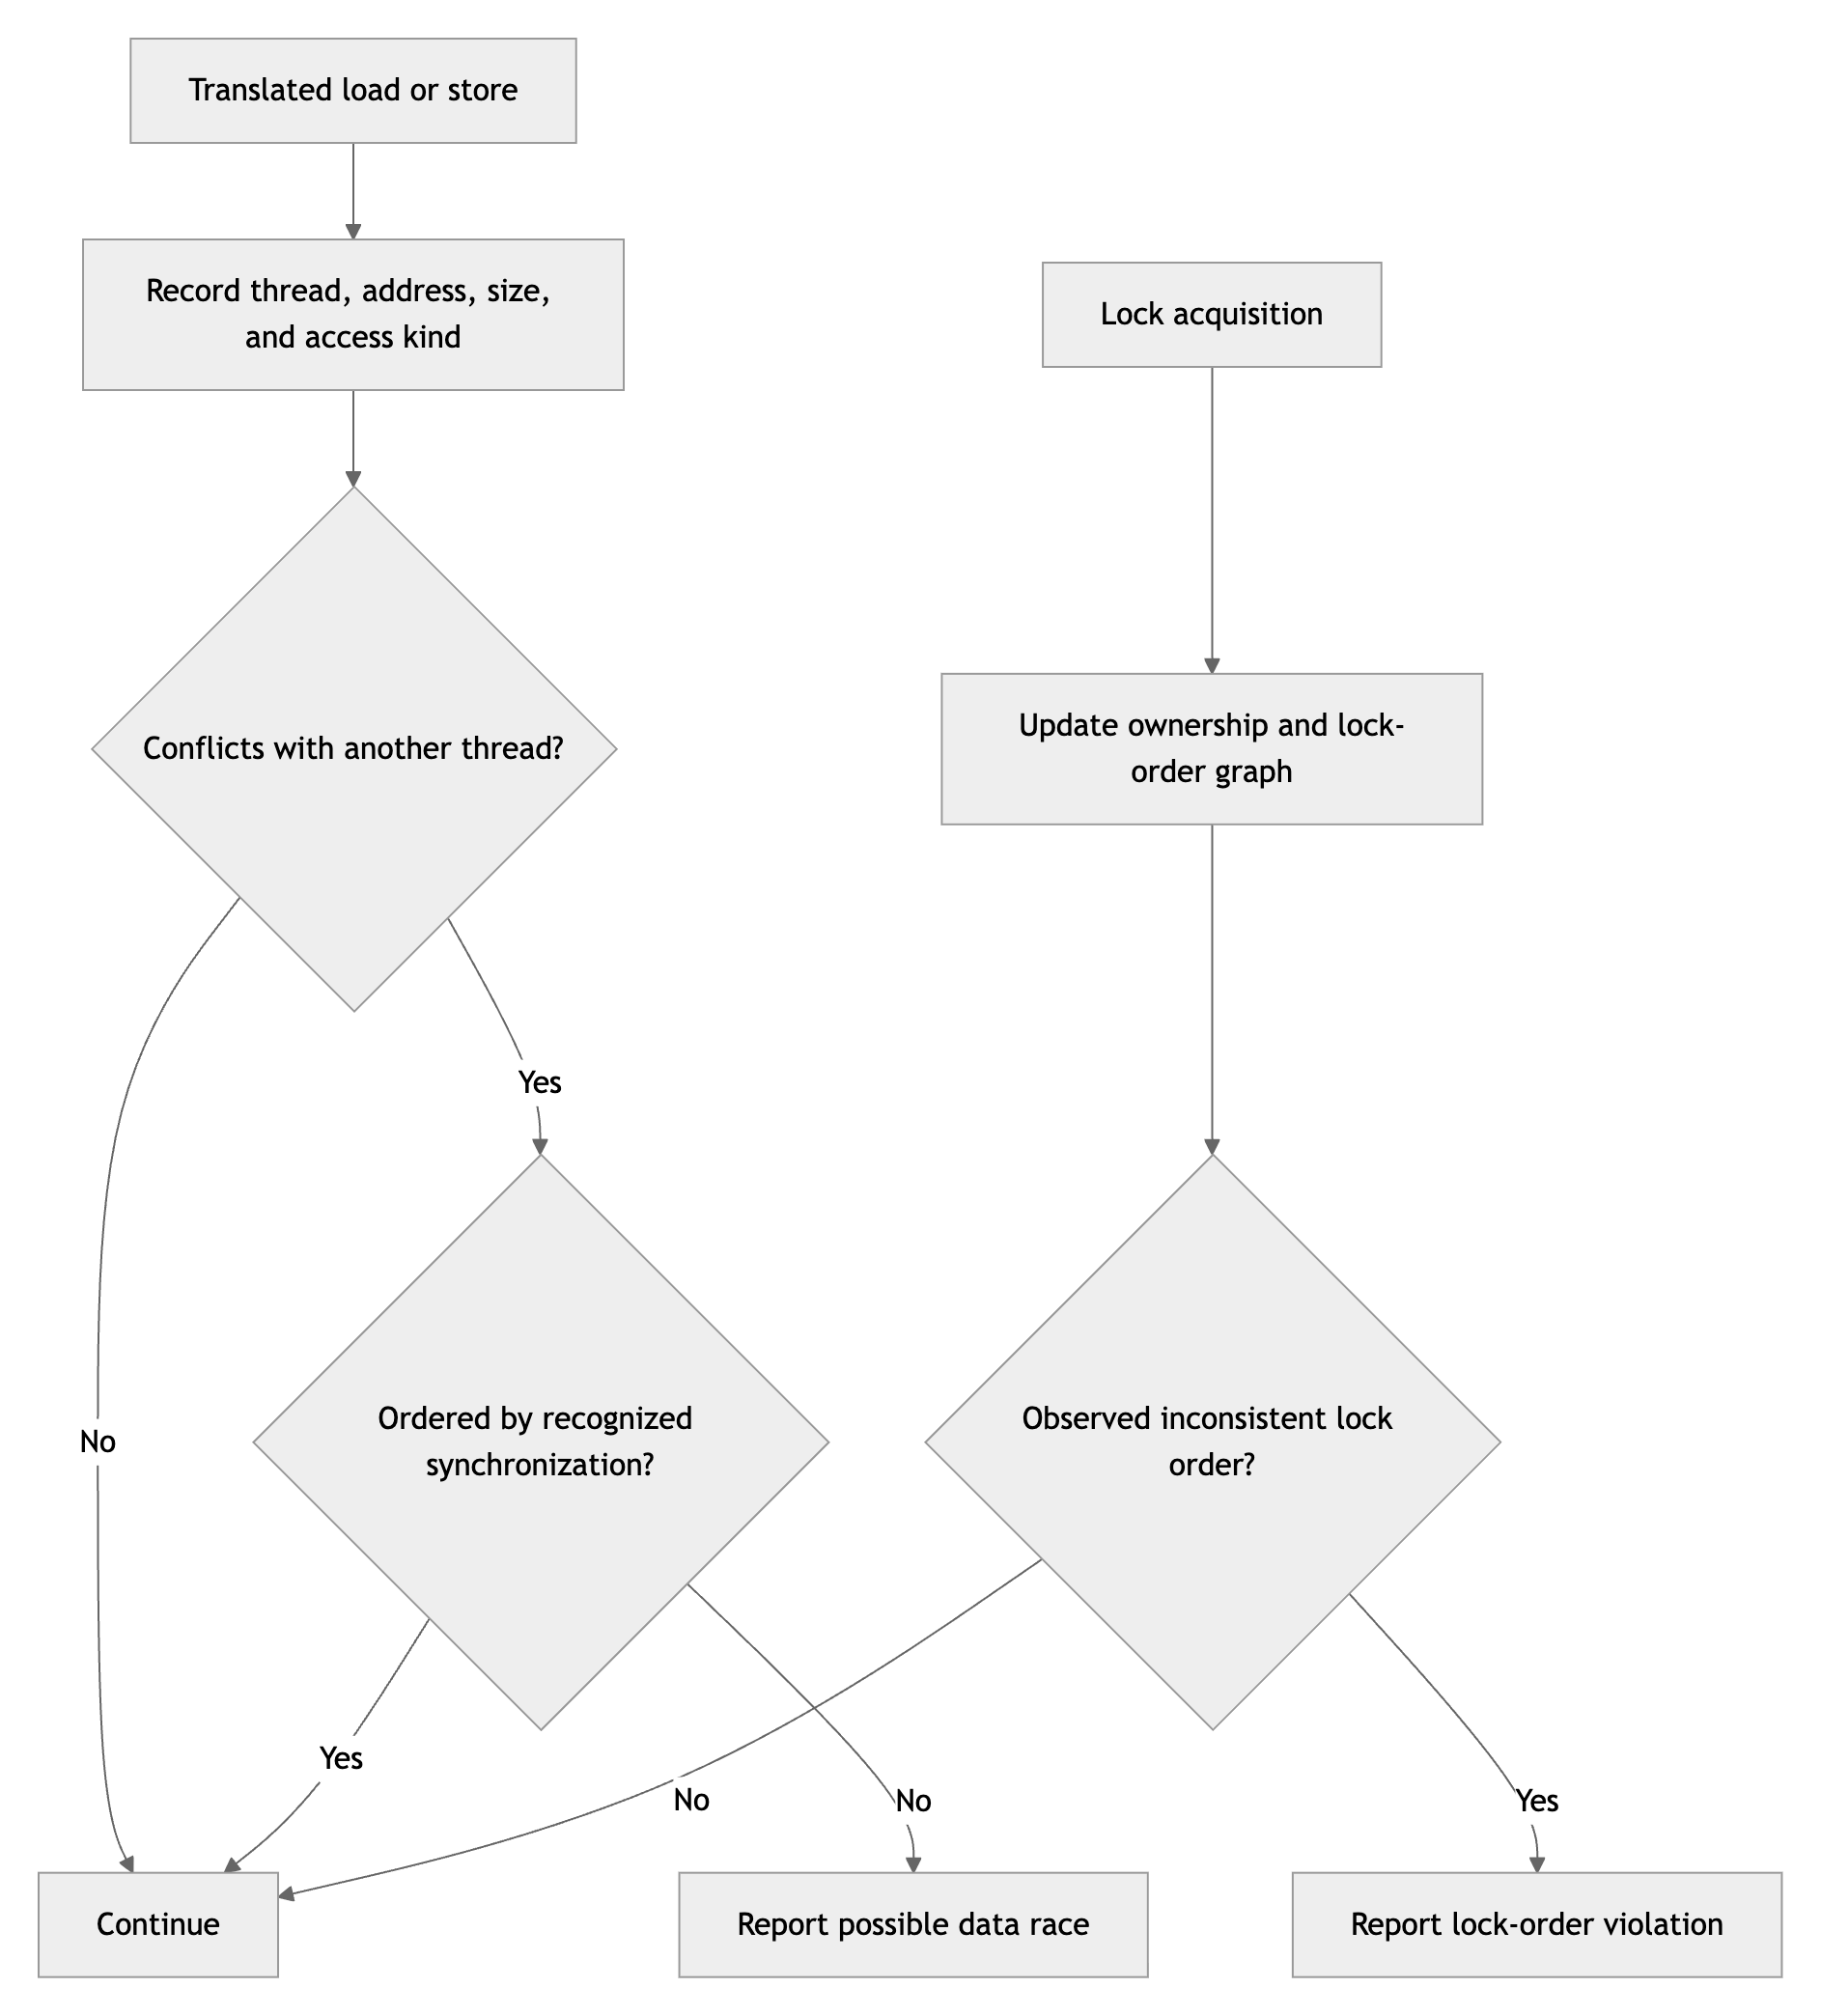
Because Helgrind observes translated machine instructions, it can analyze executed code from ordinary precompiled user-space libraries without rebuilding them with TSan. It can still misunderstand custom synchronization, unsupported instructions, inline assembly, or synchronization hidden from its wrappers.
Helgrind compared with TSan
| Property | TSan | Valgrind Helgrind |
|---|---|---|
| Instrumentation time | Compilation | Runtime translation |
| Required executable | TSan build | Usually an ordinary binary |
| Execution | Native with compiler hooks | Translated instrumented blocks |
| Race model | Happens-before/access history | Happens-before plus locksets |
| Lock-order checking | Runtime/version dependent | Explicit analysis |
| Uninstrumented libraries | Potential blind spots | Executed user code translated |
| Scalability | Usually better | Usually lower |
| Typical overhead | High | Often higher |
| Attach to running process | No | Generally no |
valgrind --tool=helgrind ./test_program
Helgrind is an independent complement to TSan, not proof that a program is race-free. Valgrind serializes translated guest-thread execution, and its high overhead substantially changes thread timing. Helgrind can nevertheless detect logical races from the absence of happens-before ordering. Conflicting accesses do not need to execute physically simultaneously to constitute a data race.
Neither Helgrind nor TSan proves deadlock freedom. Deadlock analysis also needs targeted lifecycle tests, deliberate scheduling pressure, repeated stress runs, bounded timeouts, and manual lock-order review.
5. Valgrind Massif
What it measures
Massif profiles live heap usage over execution and attributes it to allocation call paths. Memcheck’s leak classification and Massif’s growth profile answer different questions: reachable memory can still consume too much space. Massif manual.
For example, a service might retain every completed request in a cache. A pointer still reaches each entry, yet memory grows with traffic. Comparing snapshots before and after repeated requests can identify the allocation path to investigate; the application design determines whether retention is intended.
How it works
Massif uses Valgrind’s execution machinery. In heap mode, its allocation wrappers record each block’s address, requested size, extra space, and allocation stack. Allocation, resizing, and freeing update live-byte totals and an allocation tree. This accounting does not require copying the contents of the heap into snapshots.

Normal snapshots store totals; detailed snapshots also preserve allocation-tree
data. Snapshot spacing grows during longer runs, and older snapshots are thinned.
The implementation checks for peaks before reducing allocation totals during
deallocation, with a configurable tolerance. A final rise without a subsequent
deallocation can therefore escape the marked peak. These mechanisms are visible
in Massif’s record_block, unrecord_block, and maybe_take_snapshot routines.
Massif implementation.
Running Massif and reading snapshots
Run an ordinary binary with debug symbols, then inspect the generated file:
valgrind --tool=massif --time-unit=ms \
  --massif-out-file=massif.out.%p ./test_program

# Replace 12345 with the PID in the generated filename.
ms_print massif.out.12345
ms_print displays a memory graph and allocation trees. The default horizontal
axis counts instructions; --time-unit=ms selects elapsed milliseconds, and
--time-unit=B selects allocation/deallocation traffic. Snapshot heights show
live usage, rather than cumulative allocation volume.
Heap totals combine requested bytes with alignment overhead and estimated
allocator bookkeeping. --stacks=yes adds stack usage, disabled by default.
Output and options.
Heap usage, mapped pages, and RSS
Default heap mode excludes direct mmap allocations. A separate run with
--pages-as-heap=yes tracks page allocations instead of heap blocks; it cannot
be combined with --stacks=yes.
Page profiling.
Page allocation is not residency: mapped pages need not be resident in physical
memory. Use /proc/PID/smaps for per-mapping RSS and proportional set size (PSS);
Massif’s allocation totals should not be interpreted as either measurement.
Linux memory accounting.
6. Linux perf
perf measures performance. It can answer both:
- Which hardware or software events dominate the workload?
- Which functions and call paths consume execution samples?
Kernel and PMU interaction
The perf command talks to the Linux kernel’s perf-events subsystem, commonly
through perf_event_open; the target process does not need to cooperate or be
modified.
Each logical CPU normally exposes Performance Monitoring Unit (PMU) facilities. Hardware counters can count events such as cycles, retired instructions, cache references/misses, and branches/misses. Counting itself is handled mostly in hardware and has low overhead.
For sampling, a counter is configured to overflow after a period. The overflow interrupts the CPU, the kernel captures a sample into a ring buffer, and perf reads it. Interrupt handling, register capture, stack capture/unwinding, buffer writes, and the perf userspace process add overhead. Therefore, sampling is low-overhead rather than free.
Task-bound events, threads, and CPU migration
A hardware PMU counter belongs to a logical CPU, but Linux can expose a
task-bound perf event associated with a particular Linux task, identified by
a TID. The main thread has TID == PID; every worker thread has its own TID,
while the threads share a process or thread-group ID.
When a program is launched under perf with event inheritance, its initial thread and inherited worker threads receive logical perf events. The application can therefore be measured across its threads and across every CPU on which those threads run.
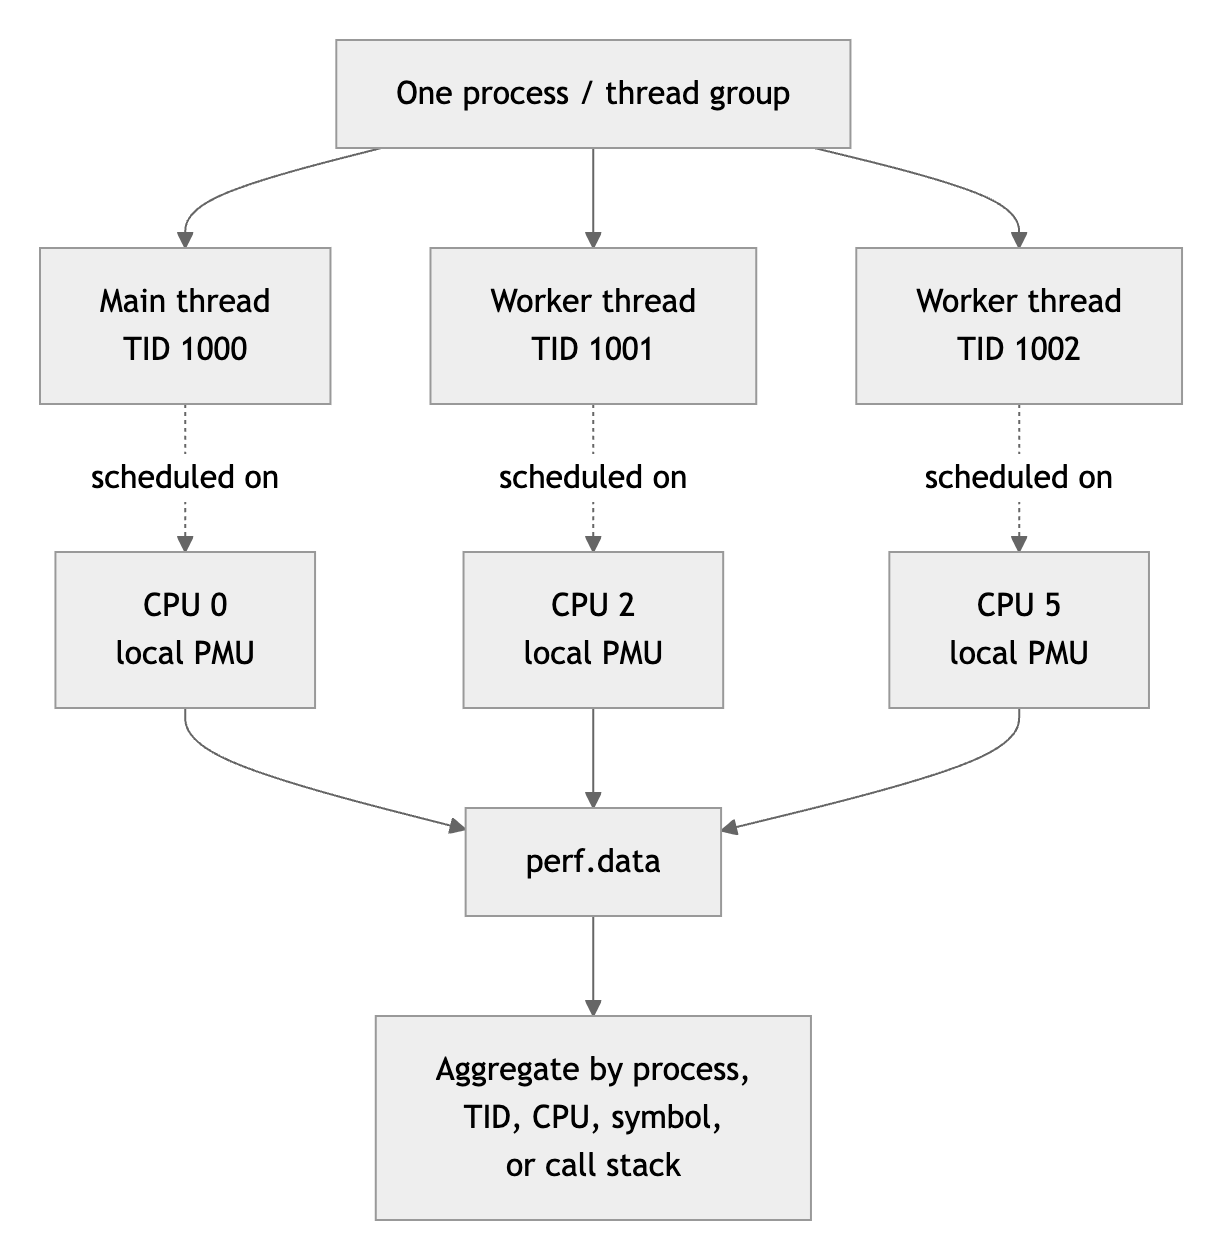
There is no single physical counter owned by the process. Instead, Linux virtualizes the CPU-local PMUs:
- When a monitored thread is scheduled onto a CPU, the kernel programs that CPU’s PMU for the thread’s logical event.
- The PMU counts only while that thread is executing.
- When the thread is switched out, the kernel stops and accounts for the partial count.
- If the thread later runs on another CPU, the kernel programs the new CPU’s PMU and continues the same logical measurement.
- Counts contributed by different physical PMUs are combined into the logical event’s total.
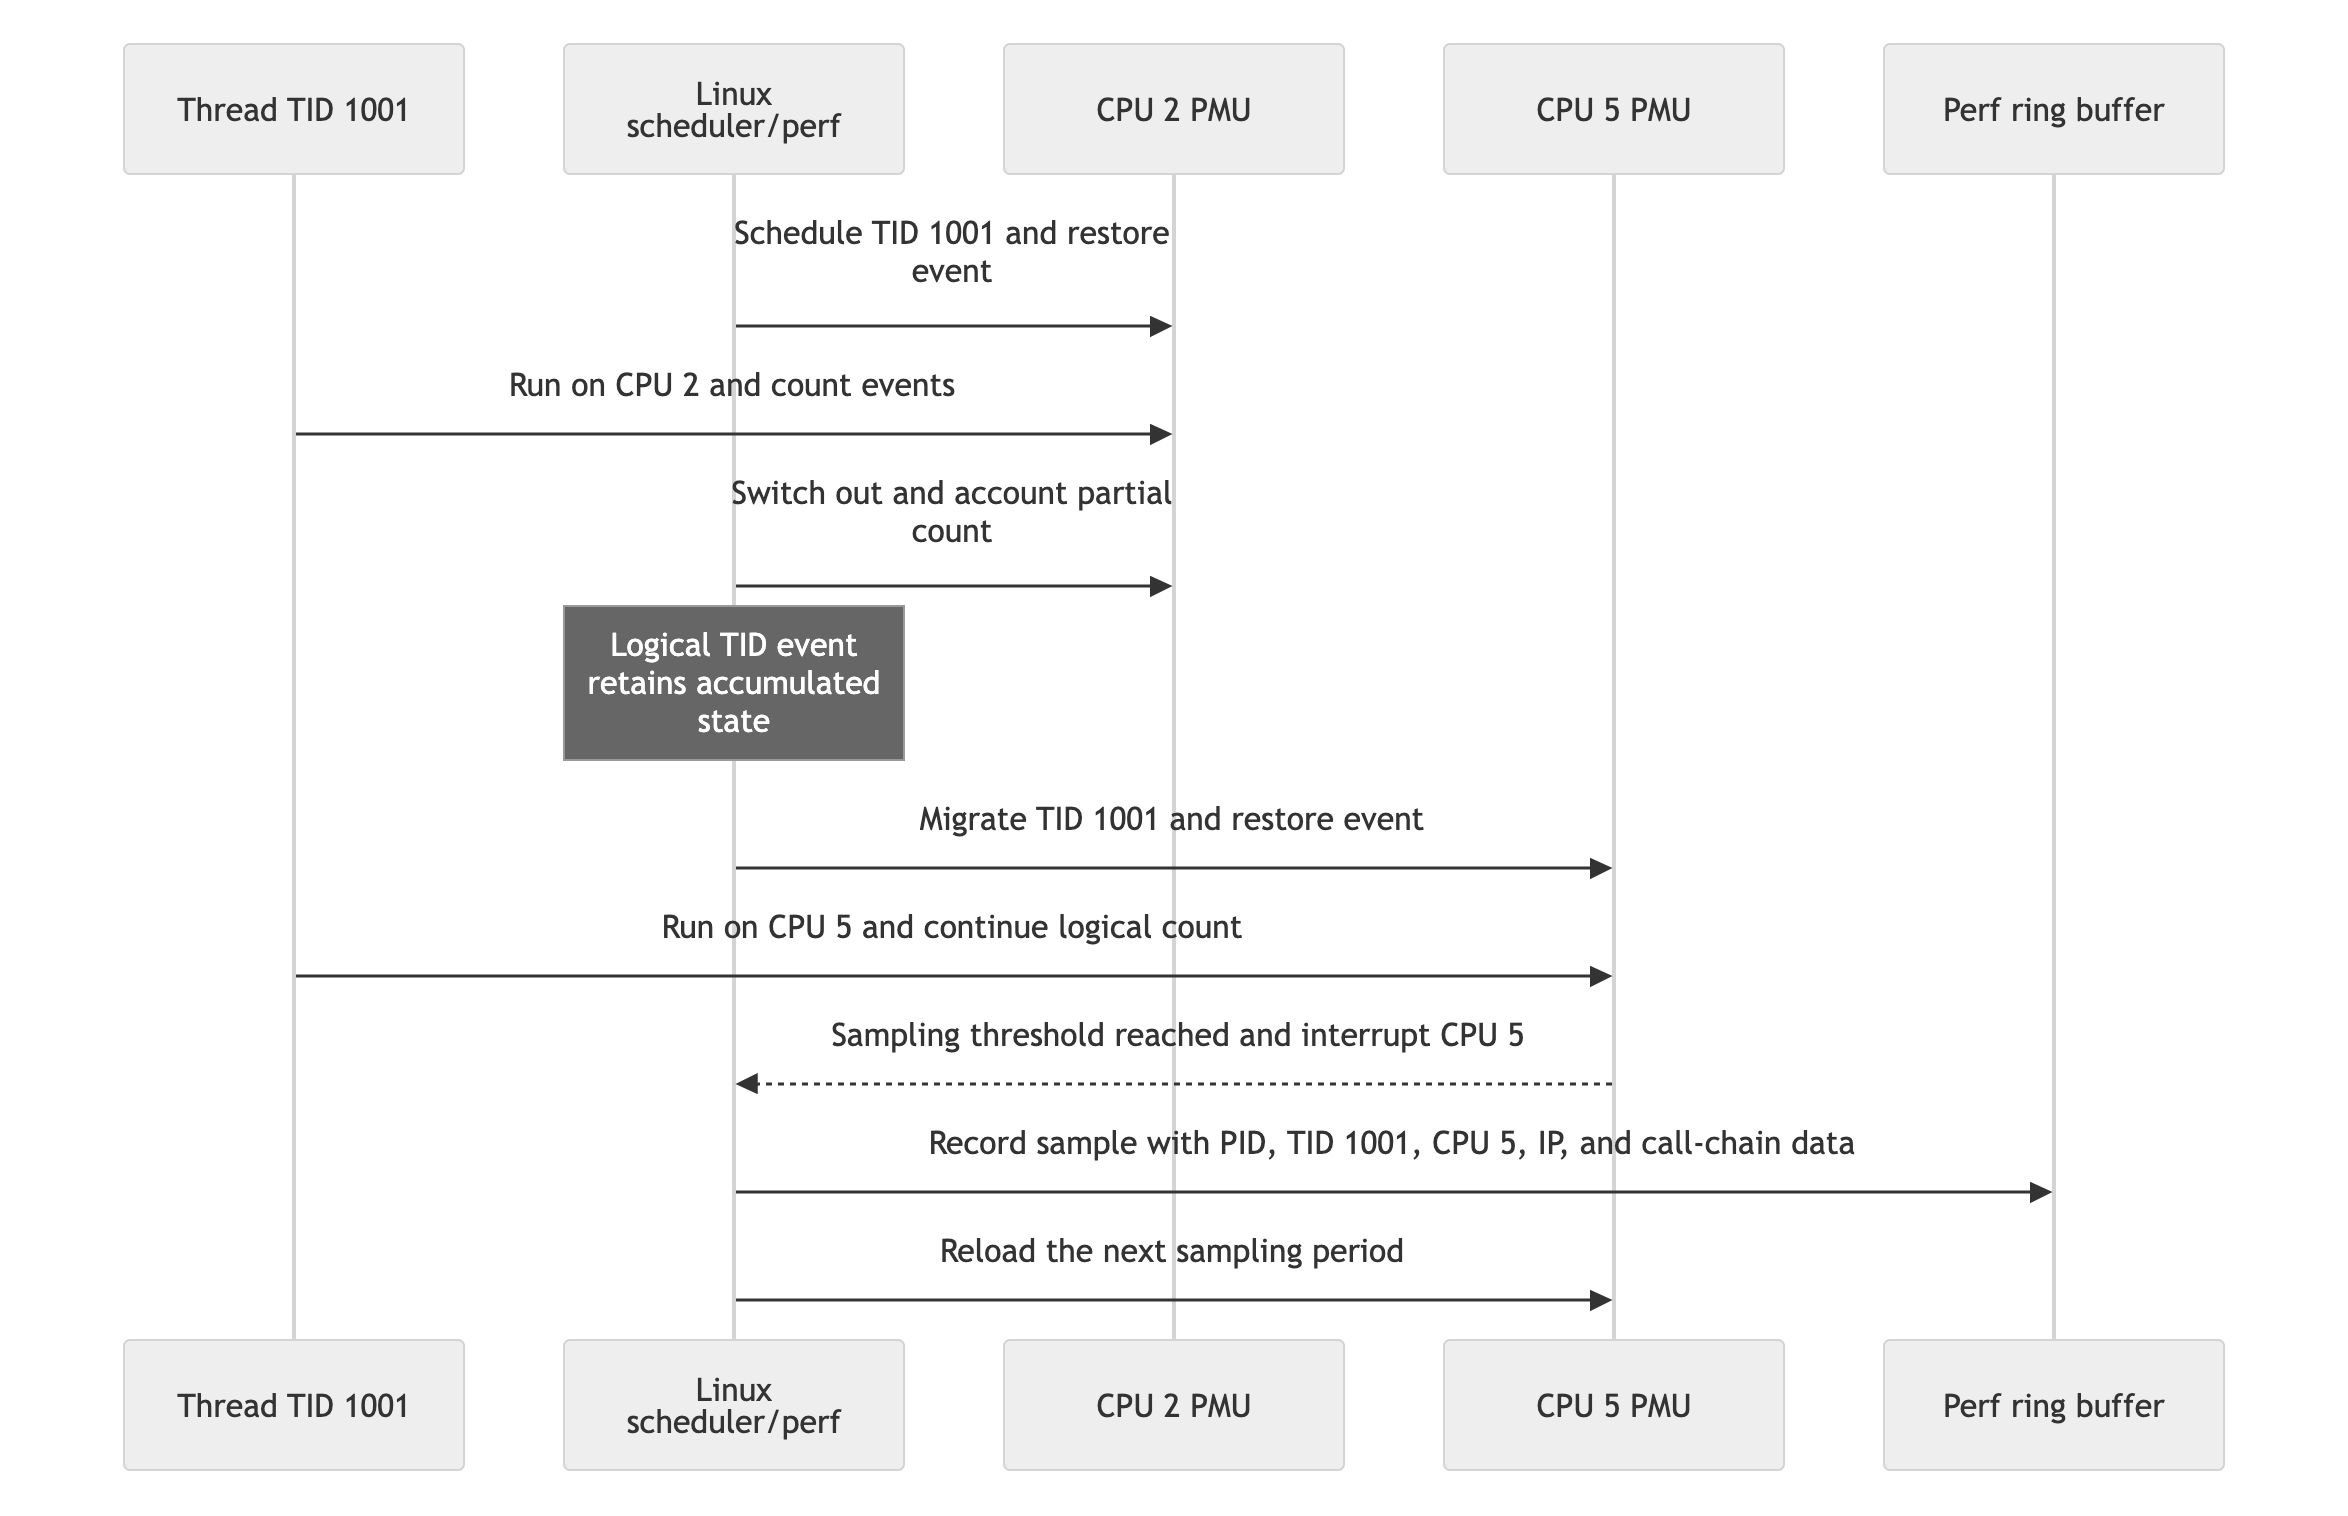
For a fixed sampling period such as -c 1000000, each task-bound event
logically progresses toward its own threshold as its thread runs. Sleeping or
blocked threads do not accumulate CPU-cycle events. When a currently running
thread’s event reaches the threshold, the PMU on that thread’s current CPU
overflows and interrupts that CPU. The kernel associates the active event with
the current task and records that task’s PID and TID.
Thus, the most precise description is:
The interrupt is physically CPU-local, while the event and resulting sample are logically task/TID-bound.
With frequency mode such as -F 99, the kernel dynamically adjusts the
sampling period to approach the requested sample rate rather than applying one
permanently fixed event count. Multiple monitored threads running concurrently
on different CPUs can independently trigger samples.
A sleeping main thread contributes few or no cycle samples even if its worker threads are busy. Whole-program profiling depends on inheriting or explicitly attaching events to the worker threads; attaching only to the main thread’s TID does not automatically measure unrelated worker execution.
perf stat: aggregate counters
perf stat reports totals such as elapsed time, cycles, instructions, cache
misses, branch misses, context switches, and migrations:
perf stat -e cycles,instructions,cache-references,cache-misses \
  ./test_program
It helps identify whether a workload is compute-heavy, cache-sensitive, branch-heavy, or affected by scheduling, but it normally does not locate the responsible functions.
perf record: runtime samples
perf record writes samples and mapping metadata into perf.data. A sample can
contain the PID, TID, CPU, timestamp, event, runtime instruction pointer, and an
optional call chain or captured stack.
perf does not record every instruction or cycle. It periodically samples execution. Lower frequency reduces overhead; a longer representative run can collect enough samples while using that lower frequency.
# Start the program under perf
perf record -F 99 --call-graph dwarf ./test_program

# Attach to an existing process
perf record -F 99 --call-graph dwarf -p PID

# Record system-wide, per-CPU activity
perf record -a -F 99 --call-graph dwarf -- sleep 30
System-wide capture associates records with CPUs and attributes them using PID, TID, and mapping information. Aggregating samples by PID or command name shows which processes were running on the CPUs at the sampling instants. Their sample shares provide a statistical view of where CPU execution was spent during the recording interval. This is useful for finding the process that deserves more detailed profiling.
System-wide recording is often noisy because it includes unrelated processes, kernel work, and binaries without available symbols. A practical approach is:
system-wide samples -> rank processes -> select a PID -> profile that PID
For example, record with perf record -a, then group or sort the report by
command and PID. The resulting percentages are sample proportions, not exactly
the same measurement as the scheduler-accounting CPU percentage shown by
top. Use perf stat, top, or pidstat when exact interval-level CPU
usage is the primary question.
perf report, perf script, and flame graphs
perf report reads perf.data, resolves addresses, aggregates samples, and
shows hot functions and call paths:
perf report -i perf.data
perf script produces textual event and stack records. Flame-graph tooling
folds and aggregates those stacks:
perf.data -> perf script -> folded stacks -> flame graph SVG
In a flame graph:
- box width is proportional to captured samples containing that function/path;
- vertical position is call depth, not elapsed time;
- horizontal placement is normally an aggregation layout, not a timeline;
- wide boxes are optimization candidates, not automatic proof of waste.
Address and symbol resolution
The complete sampling and symbolization flow is:
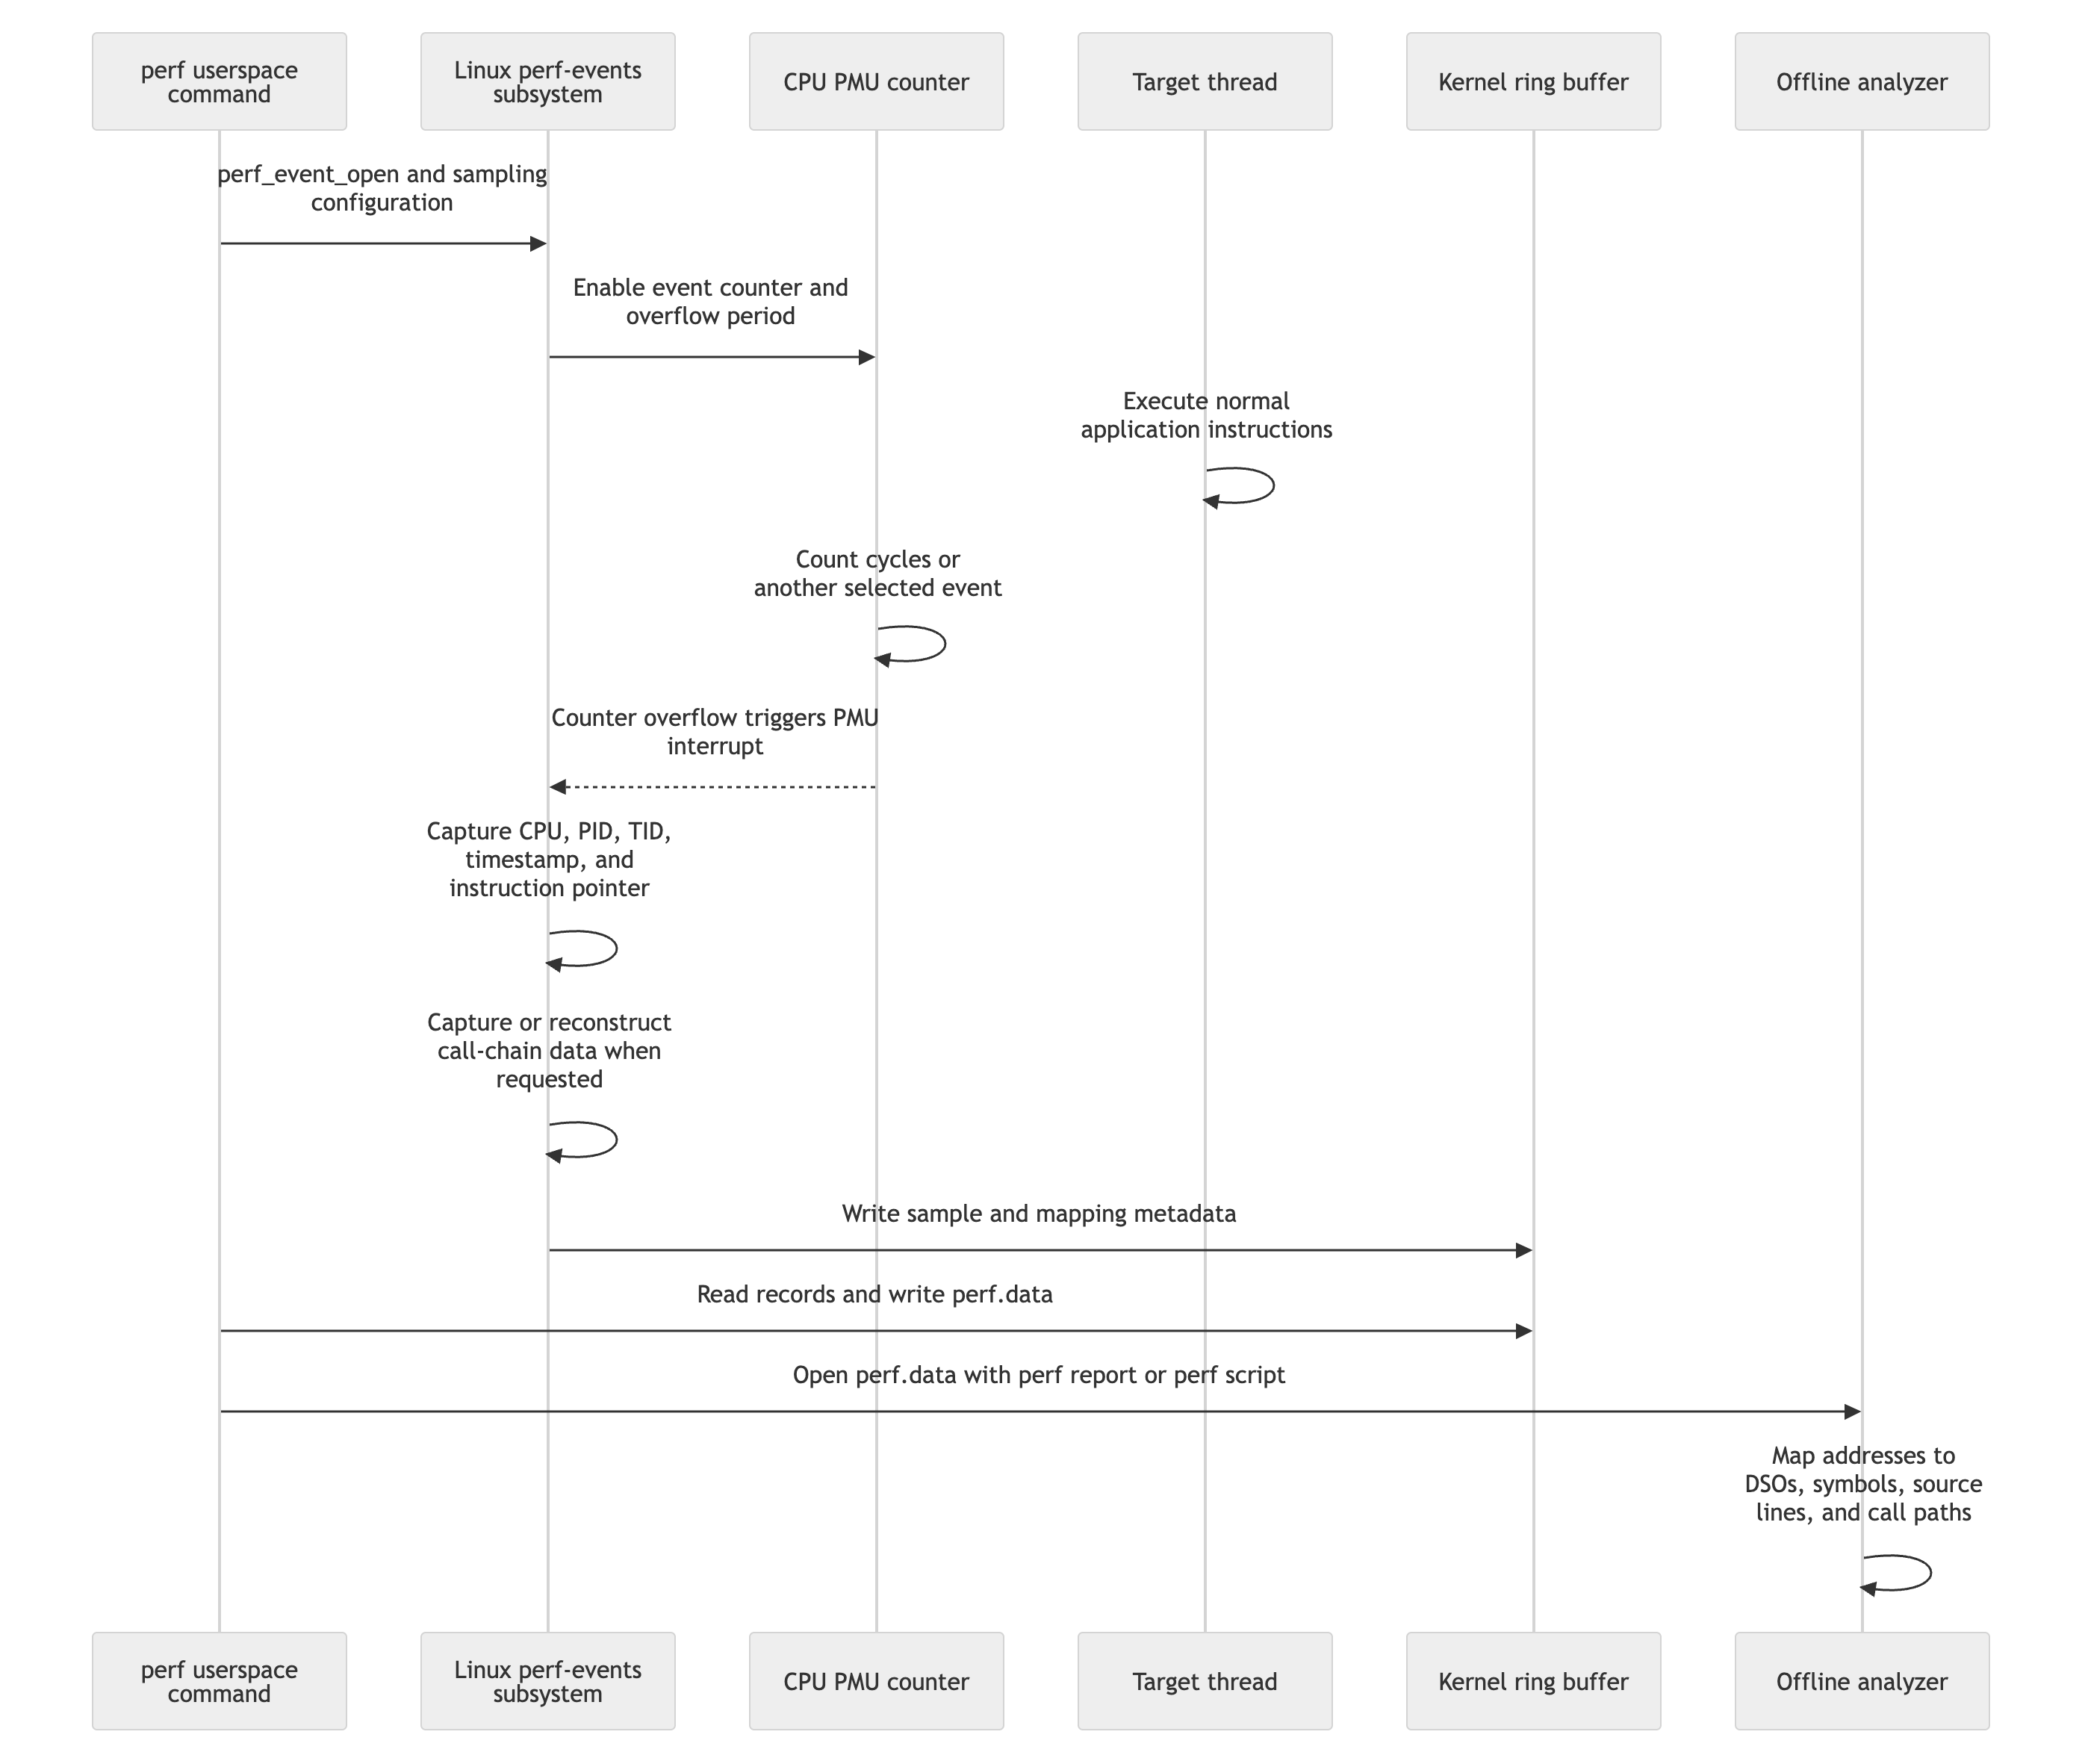
The important boundary is that the userspace perf command configures and reads the facility, while the kernel handles the PMU interrupt and records the sample. The target process does not call perf and is normally unaware that it is being sampled.
At an interrupt, the kernel can directly capture information available in the current execution context, including:
- CPU number;
- PID and TID;
- timestamp and event value;
- current instruction pointer;
- registers and stack bytes when the selected call-graph method requires them.
The PMU does not generally provide a ready-made list of caller and return addresses. The current instruction pointer is architectural CPU state. The rest of the call chain must be captured or reconstructed using one of these methods:
- Frame pointers: walk the linked stack frames and saved return addresses when the program preserves frame pointers.
- DWARF unwinding: record registers and user-stack bytes, then interpret unwind rules to recover caller frames, often during later analysis.
- Hardware branch tracing: use facilities such as Last Branch Records on supported processors to obtain recent control-flow information.
The resulting call stack describes where execution was observed at one sampling instant. It is not a record of every function call made by the process.
Recording primarily stores runtime virtual addresses, call-chain data, and
mapping information. Symbolization generally happens later in perf report or
perf script. Mapping records relate virtual addresses to executable or
shared-library file offsets and allow perf to account for Address Space Layout
Randomization.
Resolution may use executable and library symbol tables, DWARF information, build IDs, separate debug files, and kernel symbols. Without debug information, exported names may remain available, but static functions, inline calls, source files, and line numbers may be missing; otherwise raw addresses or unknown entries appear.
Preserve the exact binaries and debug files used during recording. A rebuilt
binary may not match an old perf.data file.
Debug versus RelWithDebInfo
Both CMake Debug and RelWithDebInfo builds normally contain debug
information:
Debugis minimally optimized, giving a simpler relationship between source, variables, and instructions.RelWithDebInfois optimized and retains debugging information, making its runtime behavior more representative of production. Optimization can inline, reorder, merge, or remove code and variables.
DWARF can describe line-to-instruction mappings, functions, types, scopes, and variable locations. A local variable need not have one fixed address: it can be in a register, at a stack offset, computed, moved between locations over an instruction range, or optimized away.
Use RelWithDebInfo for meaningful optimization profiling. Keeping frame
pointers can improve stack quality, with a small possible performance cost.
top compared with perf
top reads scheduler accounting already maintained by the kernel, usually via
/proc, and compares process/thread CPU-time totals across display intervals.
It does not inspect functions and has negligible effect on the target.
Linux top commonly treats full use of one logical CPU as 100%, so a
multithreaded process can exceed 100% by running on several CPUs.
top or pidstat answers which process/thread consumes resources. perf then
explains which events, functions, and call paths account for that work:
top/pidstat -> target process/thread -> perf stat -> perf record/report
7. Recommended Order
1. Start with meaningful tests
Run normal unit, integration, lifecycle, failure-path, and stress tests. Include representative traffic and repeated startup/shutdown because all following tools are workload-dependent.
2. Run ASan broadly
Use ASan first because it is fast enough for frequent broad testing and catches memory corruption that could create misleading race, deadlock, or performance symptoms. Fix confirmed ASan findings before continuing.
3. Run TSan in a separate build
Exercise concurrent communication, task scheduling, timers, startup, shutdown, and error paths. Repeat tests to produce different schedules. Fix confirmed races before trusting performance measurements.
4. Run focused Memcheck tests
Use Memcheck for ownership, initialization, failure cleanup, plugin loading, and shutdown paths. Enable origin tracking for undefined values. Interpret leak classes carefully rather than treating every still reachable allocation as a defect.
5. Run focused Helgrind and deadlock stress tests
Use Helgrind as a second view of synchronization and lock order. Combine it with repetition, scheduling pressure, and timeouts for deadlock investigation.
6. Investigate memory growth with Massif
For a memory-footprint investigation, repeat the same workload phases under Massif and compare allocation trees at growth points. After changing retention or allocation behavior, repeat the profile and check native-process memory use. Use Memcheck separately when the question is whether allocations are lost.
7. Profile CPU execution after correctness is stable
Proceed from broad observation to focused analysis:
- Use
toporpidstatto identify an expensive process or thread. - Use
perf statto characterize hardware and scheduler behavior. - Use
perf recordon a stable, representative workload. - Use
perf reportto find hot functions and call paths. - Generate a flame graph when a visual stack summary is useful.
- Optimize only a measured bottleneck.
- Repeat the benchmark and
perf statto verify overall improvement. - Rerun correctness tests and sanitizers after optimization.
The complete practical sequence is:
normal tests and stress scenarios
    -> ASan
    -> TSan
    -> focused Valgrind Memcheck
    -> focused Helgrind plus deadlock timeouts
    -> Massif for heap growth and allocation peaks
    -> top/pidstat
    -> perf stat
    -> perf record + perf report/flame graph
    -> optimize
    -> benchmark again
    -> rerun correctness tools
For routine native-code development, run normal tests and ASan frequently, TSan after concurrency changes, Memcheck and Helgrind periodically or for focused investigations, Massif for memory-footprint investigations, and perf only against an optimized representative build with matching debug symbols.